Social Class, Ethnicity, Gender and Patterns of Educational Achievement : Data
Please note that most recent data up to and including 2023 can be found here.
|
Update: Educational Attainment and School Closures due to COVID 19
Learning objectives for this document
|
Social Class Differences in Educational achievement:
Introduction
Sociological studies in advanced industrial countries including the UK have shown that educational achievements (as measured mainly by educational qualifications achieved) are closely related to social class background and that upper and middle class students on average out perform working class students at all levels of the education system. For example, sociologists from the 1950s onwards have regularly pointed to the progressive under-representation of working class students in:
higher streams in primary (i.e. middle schools)
numbers passing the 11+ examination
numbers in higher streams in grammar schools and subsequently in comprehensives
numbers remaining in school after the minimum school leaving age
numbers passing O levels, gaining high grade GCSE passes and passing A levels
numbers enrolled on undergraduate courses
numbers involved in post graduate study.
Despite a wide range of government educational policy initiatives such as the introduction of free secondary schooling for state educated students and apparently fair, objective methods of selection (the 11+ examination) for the different types of school (Grammar, Technical, Secondary Modern) in the new Tripartite system in the 1944 Education Act, the expansion of state expenditure on education, the subsequent recognition of the limitations of the Tripartite Secondary System and its replacement almost everywhere by Comprehensive Secondary Education, the raising of the school leaving age to 15 and subsequently 16, the development of Education Priority Areas , the schools initiatives too numerous to mention of the Thatcher, Major, Blair and Brown , Coalition and Conservative administrations and the expansion of opportunities for further and higher education, it can still easily be demonstrated that working class students are less likely to be educationally successful than are their middle class peers counterparts.
Social Class Differences in Educational achievement:
- Social Class and GCSE Level Attainment
- Long term trends 1989-2006
- GCSE Attainment and Free School Meal Eligibility 2008/9- 2016/17
- The Coalition’s Record on Schools: Policy, Spending and Outcomes 2010-2015 by Ruth Lupton and Stephanie Thomson
Source 1: Youth Cohort Studies of the educational achievements of 16 year olds 1989-2006 published on the Department for Education and Skills DfES [subsequently DCFS and now DfE] website.
[The 1989-1999 data refer to GCSE Examination results in for England and Wales whereas the 2001-2006 data refer to England only]
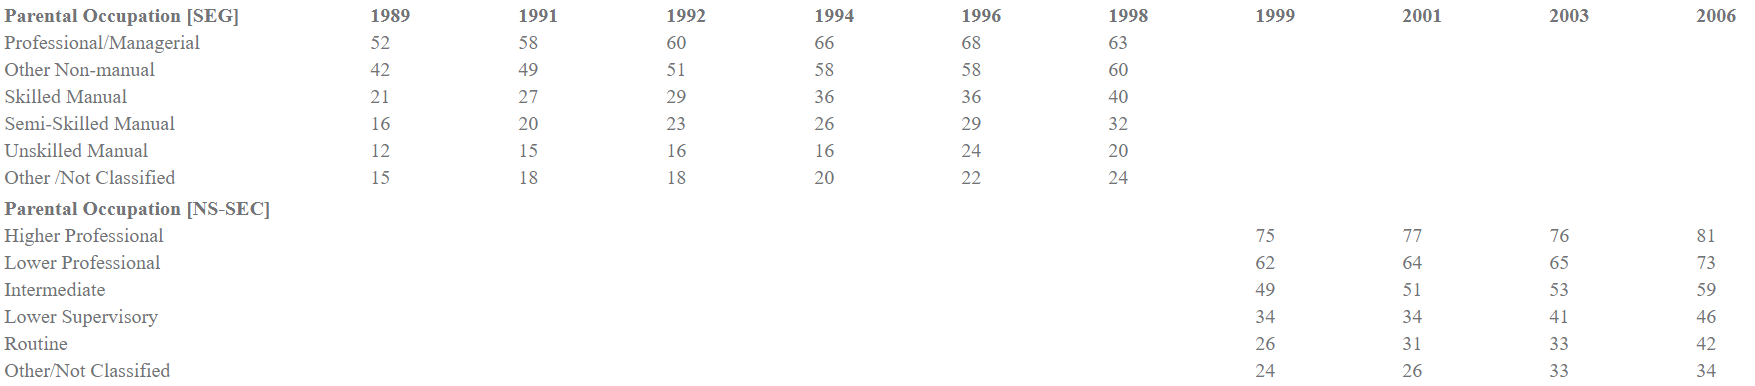
An individual’s social class position is often approximated by his/her occupation but the occupational classification schema used by the UK Government were altered in 2000 so that the statistics for 1989-1998 are not comparable with the statistics for 1999- 2006. Nevertheless the data do show that children whose parents are in professional and managerial occupations are more likely than children whose parents are in manual occupations to gain 5 or more GCSE A*-C grade passes.
For a diagrammatic presentation of these data for years 1999-2006 - Click Here to Download , once you have reached the diagram [chart two] you may also click Sheet 1 or scroll over the diagram itself if you wish to revisit the actual statistics.
Activity
|
Source 2: GCSE Attainment and Free School Meal Eligibility
I have updated this table to include 20198-19 data. It already ovelapped the margin and now does so even more. Therefiore I suggest deleted 2010/11 and 2013/14. In future more intermediate colunms can be deleted as we add future years so that it will give us quite a nice long term trend The net effect should be that there is no overlap
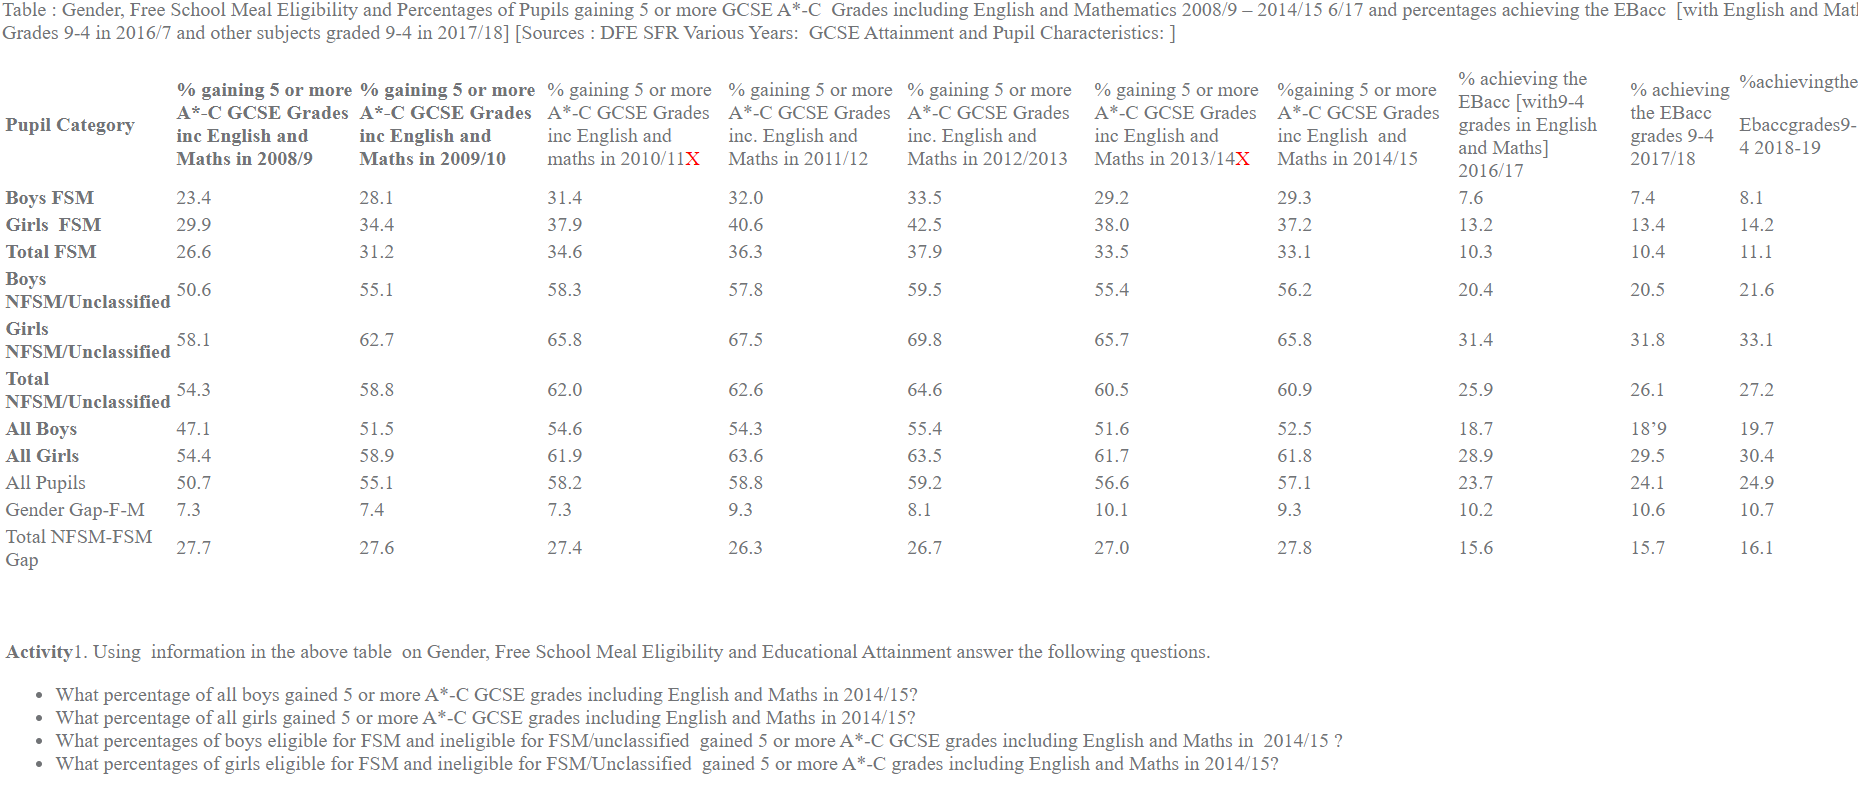
The YCS series on social class differences in educational achievement has been discontinued but the DfE continue to provide data on differences in educational achievement as between students eligible and ineligible for Free School Meals . Obviously Free School Meal Eligibility is a less than prefect measure of social class membership but these data do give some indication of the correlation between adverse economic circumstances and educational achievement at GCSE Level. Also since 2015/16 educational achievement has been measured in terms of the Progress 8 criterion and or attainment of 5 Ebacc subjects rather than in terms of attainment of 5 or more GCSE pass grades A*-C
Table : Gender, Free School Meal Eligibility and Percentages of Pupils gaining 5 or more GCSE A*-C Grades including English and Mathematics 2008/9 – 2014/15 6/17 and percentages achieving the EBacc [with English and Maths Grades 9-4 in 2016/7 and other subjects graded 9-4 in 2017/18]
Sources : DFE SFR Various Years: GCSE Attainment and Pupil Characteristics:
| Activity
1. Using information in the above table on Gender, Free School Meal Eligibility and Educational Attainment answer the following questions.
2. Notice change of date to 2018/19
Which factor seems to be the more significant influence on educational achievement : Gender or Free School Meal Eligibility? 3. Which factor seems to be the more significant influence on educational achievement: gender or social class? 4. However it is important to consider interrelationships between gender, free school meal eligibility and ethnicity. It can then be shown that using EBacc attainment as a measure of achievement in 2016/17 the overall size of the free school meal eligibility/all other students gap is heavily influenced by the size of the gap among white British students who are a large majority of the total student cohort. For White British students the FSM eligibility/all other students is far greater than the Gender gap but the reverse is true in the case of Asian students, Pakistani students, Bangladeshi students, [but not Indian students], Black African students, Black Caribbean students and Any Other Black students. For Chinese students the Gender gap was 12% but Chinese FSM pupils actually outperformed all other Chinese students. |
Source 3
The Coalition’s Record on Schools: Policy, Spending and Outcomes 2010-2015 by Ruth Lupton and Stephanie Thomson . This is a first class paper providing detailed, insightful information on Coalition schools policies. Scroll down to page 45-47 for detailed data and diagrams on educational attainment and free school meal eligibility. There are one or two technicalities here that you may need to discuss with your teachers!
2.Social Class and GCE Advanced Level Attainment
Source 4 and 4b: Attainment at Level 2 [ =attainment of 5 or more GCSEs at Grades A*-C or equivalent qualifications ] and Level 3 [attainment of 2 or more A levels or equivalent qualifications]
Click here for a DFE document entitled Level 2 and Level 3 attainment by young people in England. You may then scroll down to page 8 of this document for the Section on Free School Meal Eligibility which shows attainment by FSM and the attainment gap between the FSM group and their peers at Levels 2 and 3 between 2009 and 2013. It will be seen that both of these attainment gaps are substantial and have changed little in recent years. You may summarise these results here.
Click here for the 2018 version of this document.
For data on attainment at Level 3 by Free School Eligibility and Ethnicity in 2018. It will be seen that a substantial attainment gap exists between pupils eligible and ineligible for free school meals and that this gap varies substantially as between different ethnic groups
Click here BBC item on technicalities of Attainment 8 and progress 8 and here for a very technical article
Click here and scroll to pages 13 and 14 for calculation of Attainment 8 and Progress 8.
- Social Class and Access to Higher Education
Source 5: Focus on Social Inequality [Edited by P. Babb J. Matin and P.Haezewindt ONS 2004] provides data on relationships between social class [measured by parental occupation] and participation in Higher Education .
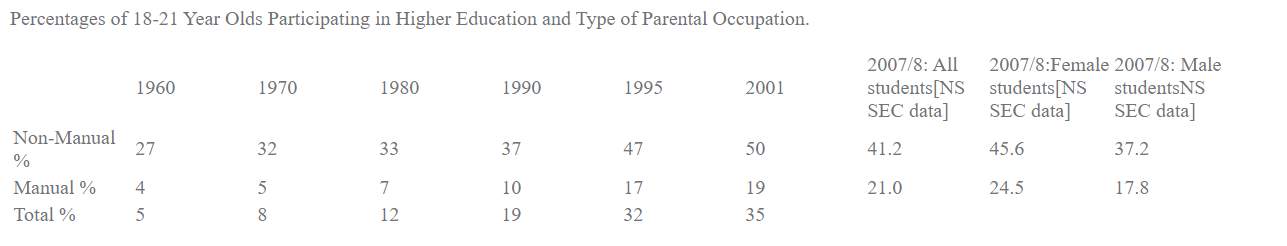
The above data indicate that, for example, in 1960 27% of the children of parents in non-manual occupations participated in Higher Education compared with 4% of the children of parents in manual occupations. Also in 1960 only 5% of all 18-21 year olds participated in Higher Education.
The final columns of the table are s taken from a 2009 Department of Business, Innovation and Skills Paper distinguishing between Higher Education Participation Rates of male and female students from NS SEC Classes1, 2 and 3 and NS SEC Classes 4,5,6 and7. Clearly the 2007/8 data are based upon different social class schema and are therefore not fully comparable with the previous data.
For a diagrammatic presentation of these data. [However I have not included the more recent DBIS statistics in this diagram since they are not fully comparable with the earlier data]
More Recent Data
Click here for DFE publication December 2019: Widening Participation in Higher Education Also once you reach the SFR you may click on National Tables and then on Table 1 to find the source of the tables which I have presented below. Download full Document in PDF - Click Here
Eligibility and ineligibility for free school meals are obviously inadequate measures of social class inequality but pages 1, 4 and 5 of the report data do nevertheless indicate that social class inequality , although imperfectly measured, does have a significant impact on access to Higher Education.
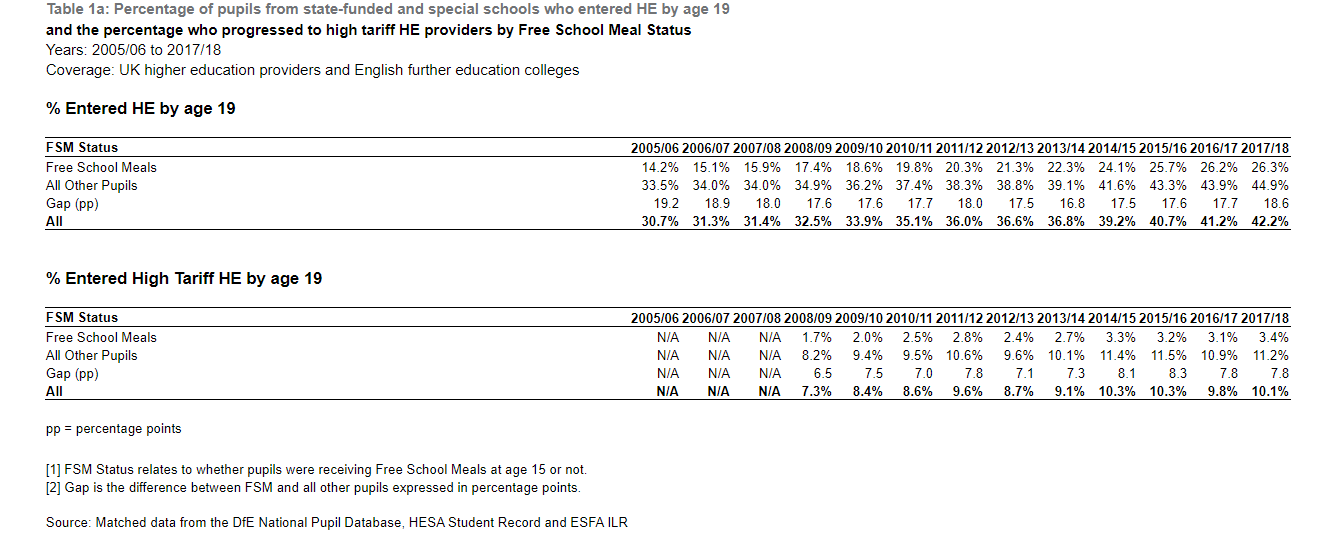
- Clearly The Gap in access to Higher Education between pupils eligible and ineligible for free school meals remains substantial
- However the are also significant regional differences in this access gap. Note especially the performances of London pupils eligible and ineligible for free school meals
- Access to more selective Higher Education Institutions is more likely for independent school students than for state school students
- There are also significant social class differences in post-graduation employment in high skill occupations
Click here for a Channel 4 Fact Check which provides very useful information on Social Class and Access to HE
Click here for useful article 2015
ActivityWhat has happened to total participation in Higher Education since 1960?
|
Elitist Britain : the educational background of the Britain’s leading people [Sutton Trust Report June 2019]
Elitist Britain 2019 (Sutton Trust Report: June 2019)
Approximately 7% of UK pupils are educated in private schools and privately educated pupils[ especially those from prestigious Public Schools such as Eton and Harrow are disproportionately more like to secure employment in elite occupations. The above report provides very detailed information on this issue . It also has a clear concise Executive Summary.
Office of National Statistics Data 2011 indicate that individuals ’ educational qualifications have a major impact on their earnings potential.
Click here for the relevant ONS publication
The above data illustrate that there are very significant social class differences in educational achievement and also that higher educational achievements are associated with higher earnings.
- The Youth Cohort Study data indicate strong relationships between parental social class and educational achievement at GCSE level.
- Pupils eligible for free school meals are on average less successful at GCSE level than pupils not eligible for free school meals.
- The same applies to Level 3 Qualifications [Source 4]
- There are strong relationships between social class membership and participation in Higher Education .
- There are strong relationships between educational qualifications and earnings for both men and women
Taken in combination these findings mean that many working class children are themselves unlikely to earn high incomes in adult life because of their limited educational qualifications. Class advantage is to some extent transmitted from generation to generation although many working class children are successful in education and socially mobile in their employment careers.
Ethnic Differences in Educational Achievement
In 2023 I produced a new separate document on Ethnicity and Educational Achievement Data which you may access here. Information is provided on ethnicity and school readiness and ethnicity and educational achievement at Key Stage 2, Key Stage 4, GCE Advanced Level and Higher Education Level. Interconnections between ethnicity, gender and free school meal eligibility are also considered in some detail.
Gender and Educational Achievement
More detailed information on Gender and Educational Achievement may be found in my documents on Gender and Educational Achievement and Gender and Subject Choice.
However the main points in relation to gender and educational achievements in England and Wales are as listed below
1 Gender and Key Stage 1 and Key Stage 2 Achievement
In Key Stage 1 tests girls outperform boys in Reading and Writing by 8%-13% but gender differences in Mathematics results are small and whereas in 2010 girls narrowly outperformed boys in Mathematics, the reverse was the case in 2022. Click here for relevant statistics. In Key Stage 2 tests in 2022 a larger percentage of girls than of boys reached the expected standard in all subjects combined. However as of April 2023 results in all individual subjects were not yet available. There were no Key Stage 2 tests in 2020 and 2021 but in 2019 a larger percentage of girls than of boys reached the expected standard in all subjects combined although the girls outperformed the boys in Mathematics by only 1%. At the higher standard girls again outperformed boys in all subjects combined but boys outperformed girls by 5% in Mathematics. Students may use this data to assess whether and to what extent gender differences in educational achievement are apparent at an early age. Click here for BBC item on gender and pre-school educational levels. Click here for Key Stage 2 results data in 2022 and here for Key Stage 2 results data in 2018 [ Scroll to page 9]
2 Gender and GCSE Level Achievement
- For many years the gender gap in achievement was measured in terms of the percentages of males gaining 5 or more HGCSE passes at grades A*-C including English and Mathematics and in recent years 8-10& more of females than of males reached this standard. Click here BBC Coverage of Gender Gap at GCSE Level New link added February 2020
- From 2016 onwards pupil achievement at GCSE examinations is measured is measured in terms of Grades 9-1 and the headline measures of Pupil achievement are now the percentages of Pupils achieving grades 5or above in English and Mathematics, the average Attainment 8 score of all pupils and the EBacc entrance rates and average points score per EBacc subjects
- Gender Differences in Achievement at GCSE Level are illustrated in the following table.
- Percentages of Male and Female Student Entries and GCSE Examination Grades Cumulative Percentages UK 2016-2022
| 2016 | 2017 | 2018 | 2019 | 2020 | 2021 | 2022 | |
| 1/G or above Females | 98.8 | 98.9 | 98.8 | 98.8 | 99.7 | 99.2 | 98.9 |
| 1/G or above Males | 98.0 | 97.9 | 97.8 | 97.8 | 99.5 | 98.7 | 98.7 |
| 4/C or above Females | 71.3 | 71.0 | 71.4 | 71.7 | 80.2 | 80.6 | 76.7 |
| 4/C/ or above Males | 62.4 | 61.5 | 62.3 | 62.9 | 72.3 | 73.6 | 69.8 |
| 7/A or above Females | 24.1 | 23.6 | 23.7 | 24.1 | 30.2 | 33.4 | 30.0 |
| 7/A or above Males | 16.8 | 16.3 | 17.2 | 17.6 | 22.2 | 24.4 | 22.6 |
- You may also click here for recent data on the achievement of boys and girls measured in terms of the above mentioned range of criteria all of which indicate that girls are outperforming boys at GCSE Level.
- Females outperform males at GCSE level in every major ethnic group.
- For all pupils at GCSE level the attainment gap between pupils eligible for free school meals and all other pupils is greater than the attainment gap between boys and girls.
- However, this total figure arises because of the large FSM/Other attainment gaps among British and White pupils which make up a large proportion of the total. In several ethnic minority groups, the gender gap is greater than the FSM/Other Gap.
- There are some significant gender differences in subject choice at GCSE level, but these occur mainly in minority subjects.
Gender and GCE Advanced Level Attainment
- Until the late 1980s males out-performed females in GCE Advanced Level Examinations but this then began to change.
- Between around 1990 and 2010 females were more likely than males to gain 3 A Level passes and also more likely to gain high grade passes although the overall differences in pass rates were smaller than at GCSE Level
- The following table illustrates the recent Gender Differences in achievement At GCE Advanced Level achievement.
- Gender and GCE Advanced Level Results 2010- 2022
| 2010 | 2011 | 2016 | 2017 | 2018 | 2019 | 2020 | 2021 | 2022 | |
| Female A*-E | 98.1 | 98.3 | 98.5 | 98.3 | 98.1 | 98 | 99.8 | 99.6 | 98.7 |
| Male A*-E | 97 | 97.3 | 97.6 | 97.3 | 97.1 | 97 | 99.7 | 99.3 | 98.1 |
| Female A*-C | 77.7 | 78.4 | 79.7 | 79.3 | 78.7 | 77.6 | 89.8 | 90.7 | 82.6 |
| Male A*-C | 72.7 | 73.7 | 75 | 75.3 | 75.1 | 73.7 | 85.6 | 85.9 | 80.4 |
| Female A*/A | 27.9 | 27.7 | 26 | 26.1 | 26.2 | 25.5 | 40 | 46.9 | 36.4 |
| Male A*/A | 26.1 | 26.2 | 25.7 | 26.6 | 26.6 | 25.4 | 36.7 | 42.1 | 35.2 |
| Female A* | 8.3 | 8.2 | 7.7 | 7.8 | 7.6 | 7.5 | 14.5 | 19.7 | 14.8 |
| Male A* | 7.9 | 8.2 | 8.5 | 8.8 | 8.5 | 8.2 | 14.3 | 18.4 | 14.4 |
Further information on Gender Differences in GCE Advanced Level results and on Gender differences in Further and Higher Education can be found here.
Gender and Access to Higher Education
Recent Data from the Higher Education Statistics Agency 2018/19
Females continue to be more likely than males to enrol for Higher Education Courses. Some students self- identify as “Other” rather than male or female
The gender differences in subject choice which occur at GCE Advanced Level continue in Higher Education
Gender Differences in Degree Results 2011/12- 2016/19
These statistics may be summarised as follows. Females are now marginally more likely than males to gain First Class Honours Degrees and quite significantly more likely than males to gain Upper Second Class Degrees
| 1st Class % | 2:1% | 2.2% | 3rd/Pass % | |
| Males 2017/18 | 27 | 46 | 21 | 5 |
| Females 2017/18 | 28 | 50 | 18 | 4 |
| Other 2017/18 | 33 | 48 | 15 | 4 |
| Males 2018/19 | 27 | 46 | 21 | 5 |
| Females 2018/19 | 29 | 50 | 18 | 4 |
| Other 2018/19 | 33 | 45 | 19 | 3 |
| Males 2019/20 | 34 | 46 | 21 | 5 |
| Females 2019/20 | 36 | 48 | 14 | 3 |
| Other 2019/20 | 41 | 40 | 17 | 3 |
| Males 2020/21 | 35 | 46 | 16 | 3 |
| Females 2020/21 | 37 | 46 | 13 | 3 |
| Other 2020/21 | 45 | 43 | 9 | 3 |
| Males 2021/22 | 31 | 46 | 19 | 5 |
| Females 2021/22 | 33 | 47 | 16 | 5 |
| Other 2021/22 | 38 | 44 | 15 | 3 |
Useful Links
Click here for a report from HEP1 on the underachievement of young men in higher education and here for Guardian coverage of this report May 2016
Click here for Mind The Gap: Gender Differences in Higher Education [Rachel Hewitt; 2020]
Click here for Women and STEM