- Section Two: Ethnicity and Educational Achievement : Data
- Section Two (B): Ethnicity and Educational Achievement : Statistical Update - Click here [Added November 2023]
- Section One: The Meanings of "Race" and Ethnicity - Click Here
- Section Two: Ethnicity and Educational Achievement: Data
- Section Three: Ethnicity and Educational Achievement : Essay - Click Here
- For a PowerPoint on “Race”, Ethnicity and Educational Achievement. - Click here
Introduction and Summary
Official statistics document patterns of ethnic educational attainment from school readiness at ages 4-5 to access to higher education and degree classification. For many years and at all educational levels Chinese and Indian students have outperformed students from all other ethnic group. The White Category contains White Irish students who perform well, White British students who are numerically by far the most significant White category, Gypsy Roma, Travellers of Irish Heritage, and other White students. Within the White category White British students have traditionally outperformed students of all ethnic groups other than the Chinese and Indians but more recently Bangladeshi and Black African students have overtaken White and White British students and Pakistani students also now outperform White British students on some measures of Key Stage 4 attainment and in terms of their access to university. The attainments of Afro-Caribbean students have improved but their attainments are still slightly lower than those of White British students but within the White category the attainments of Gypsy Roma and Traveller of Irish Heritage students are unfortunately low.
The statistics also document ethnic educational attainment by gender and free school meal eligibility. Females are shown to outperform males in all ethnic groups and “other students” [ i.e., those not claiming free school meals] outperform pupils eligible for free school meals in every ethnic group. For all pupils combined the FSM eligibility gap in attainment is greater than the gender gap in attainment but this is not the case for every ethnic group at every educational stage [ see for example, the Key Stage 2 data below]. Also, Free school meal eligibility gaps are considerably higher for White students than for students in other ethnic groups and sociologists continue to investigate the causes of relatively low educational attainment of free school meal eligible white students [ and particularly white boys] by comparison with the educational attainments of free school meal eligible students in other ethnic groups.
In the rest of this document, I shall provide some statistics which illustrate patterns of ethnic educational achievement. I rely especially on Ethnicity Facts and Figures: Education, skills and training. and on Key Stage 2 attainment [revised] 2022, Key Stage 4 Performance 2021/22, A Level and other 16-18 results 2021/22 and Widening Participation in Higher Education : 2022. The rest of the document is divided into four sections.
- Section 1: From School Readiness to Key Stage Two
- Section 2: Key Stage 4: Ethnicity, Free School Meal Eligibility and Gender
- Section 3: Ethnicity and A Level Achievement
- Section 4: Access to Higher Education and Degree Results
Section 1: From School Readiness to Key Stage Two
- School Readiness
There are significant differences in school readiness among 4 and 5 year olds and in attainment levels in Key Stage 2 assessments. Also, within each ethnic group there are significant variations according to gender and free school meal eligibility
Title Percentage of 4 to 5 year ols who met the expected standardin development by ethinicity. Location England time period 2018 to 2019 school year. Source: Early years foundation stage profile results:2018 to 2019 Ethnicity facts and figures GOV.UK.
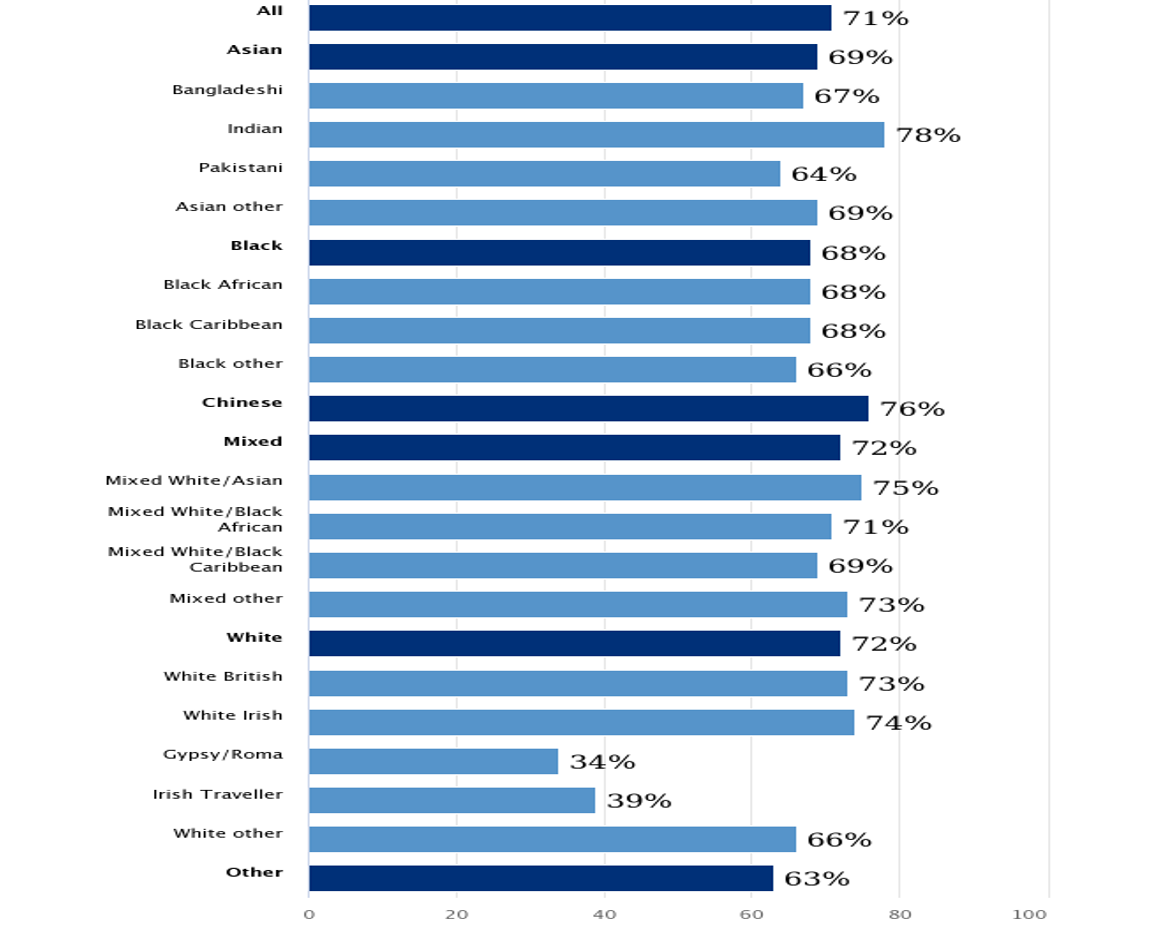
In summary the average school readiness of 4-5 year olds was 71%. Bangladeshi, Pakistani, Asian other and Black children scored slightly below this average; Mixed ethnicity children and White children scored slightly above the average and Indian and Chinese children scored slightly above average. Chinese and Indian children scored significantly above the average and Gypsy Roma and Traveller of Irish Heritage children scored significantly below the average.
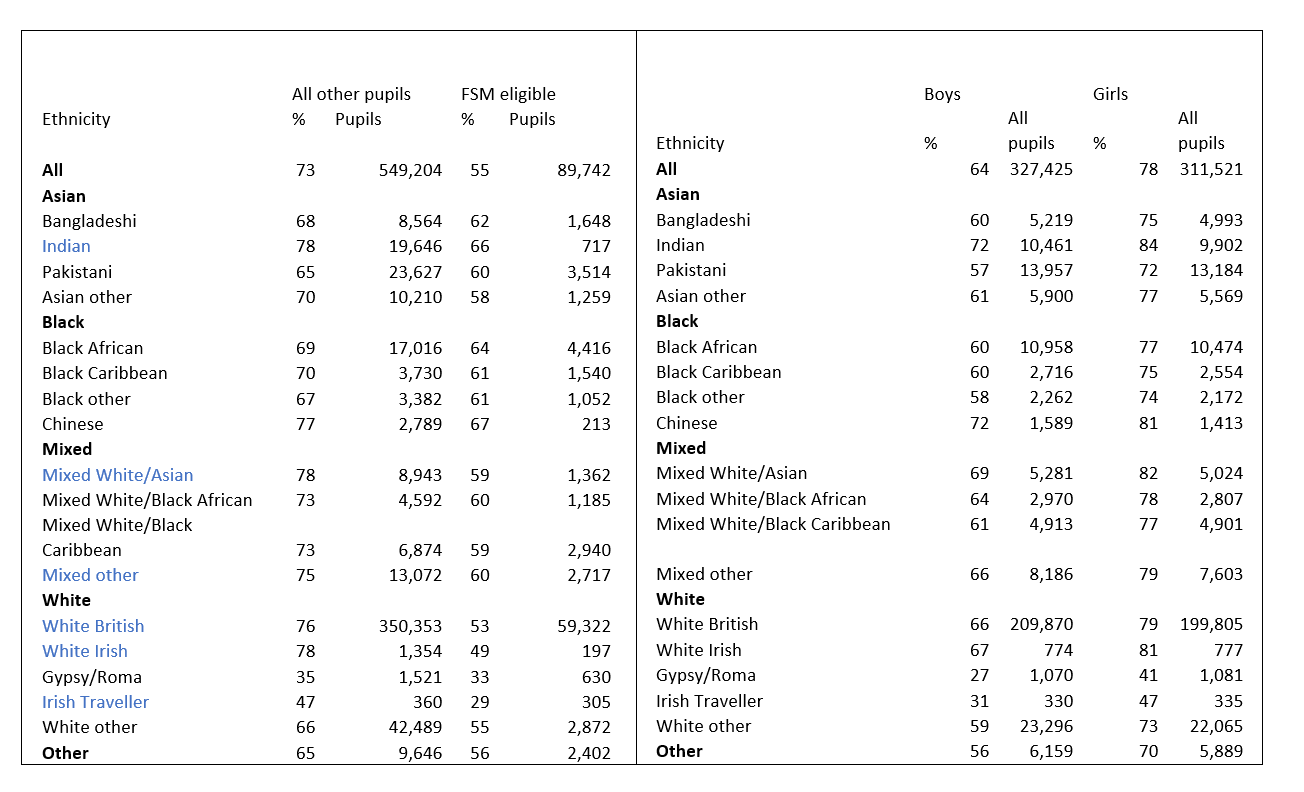
Within each ethnic group there are differences in school readiness related to gender and free school meals. Among all pupils the FSM eligibility gap [18%] is greater than the Gender gap [14%] but this is because the FSM eligibility gap [23%]is much greater than the Gender gap [13^]among White pupils and this more than offsets the fact that among Asian and Black pupils the Gender gap generally exceeds the FSM eligibility . I have typed in blue cases where the FSM Gap exceeds or is equal to the Gender Gap.
- Key Stage 2: Ethnicity, Freer School Meal Eligibility and Gender

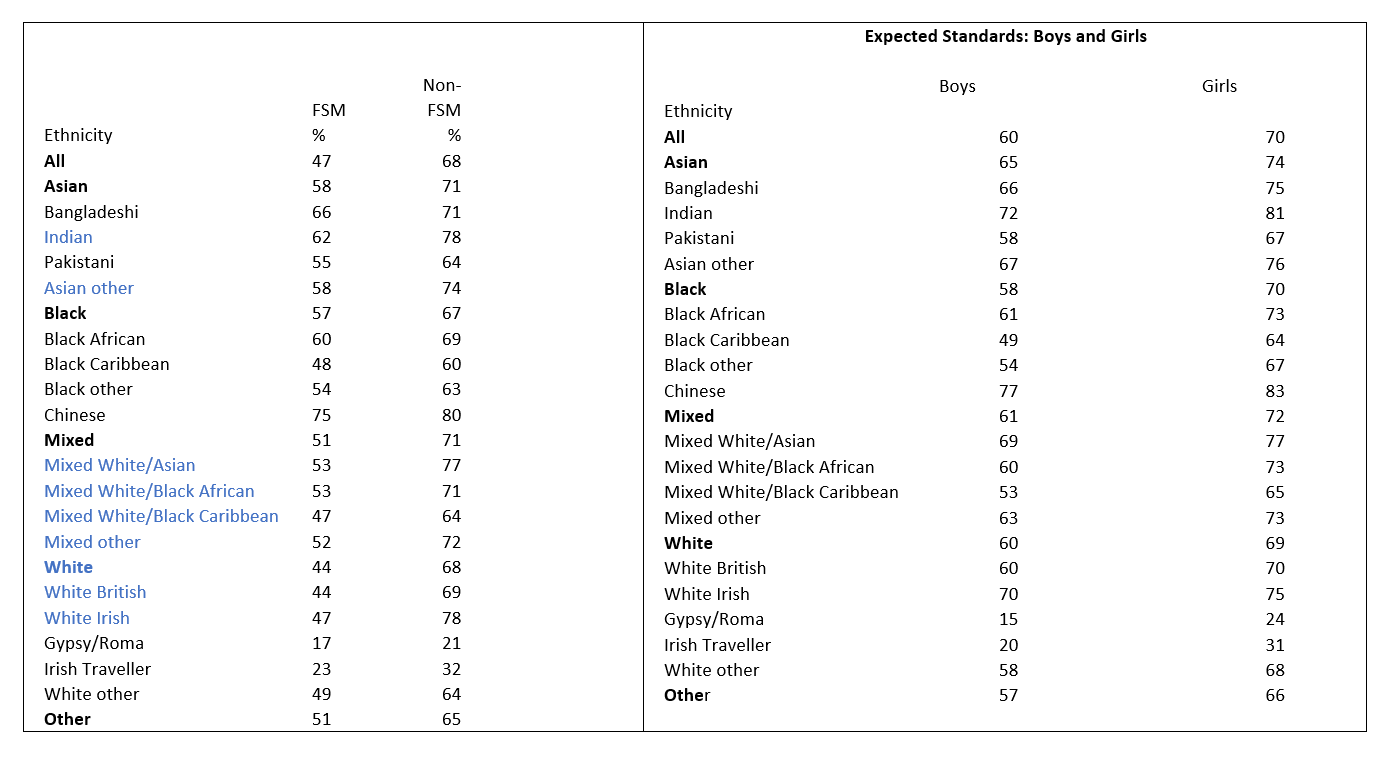
Within each ethnic group there are differences in percentages of pupils reaching the Key Stage 2 Expected Standard related to gender and free school meals. These patterns are very similar to those relating to school readiness. Among all pupils the FSM eligibility gap [21%] is significantly greater than the Gender gap [10%] but this is because the FSM eligibility gap is much greater than the Gender gap among White pupils and this more than offsets the fact that among Asian and Black pupils the Gender gap exceeds the FSM eligibility gap although in the Key Stage Two assessments FSM Gaps are greater than Gender gaps for many Mixed Race pupils. I have typed in blue cases where the FSM Gap exceeds or is equal to the Gender Gap.
Ethnicity and Key Stage Two Attainment in 2022
Click here for ethnicity and achievement at Key Stage Two [Ethnicity data subdivided by gender and free school meal eligibility are not provided for 2022]
Click here for detailed information on Ethnicity and Key Stage 2 Attainment 2018/19- 2021/22
- Section 2: Key Stage 4: Ethnicity, Free School Meal Eligibility and Gender
From the 1950s and 1960s onwards it was pointed out that the levels of educational attainment of Afro-Caribbean, Bangladeshi and Pakistani students have in general been lower than those of White British students while those of Indian and Chinese pupils have exceeded those of White British students. However, in the last 20 or so years there have been significant changes in patterns of ethnic educational achievement while recent changes in the criteria adopted to measure attainment at GCSE Level have also complicated the picture. Further information on these various GCSE criteria is provided below.
Nowadays while Chinese and Indian students are still by far the most successful ethnic groups at GCSE Level, Bangladeshi and Black African students have now overtaken White British students. In the last 4 years the GCSE attainment levels of Pakistani students and White British students have been very similar. For example, Pakistani students have outperformed White British students in terms of Attainment 8 scores in 2 of the last 4 years but White British students have outperformed Pakistani students in terms of GCSE attainments in English and Maths in 3 of the last 4 years.
Afro-Caribbean students’ educational achievements have increased although their attainment levels at GCSE Level remain below those of White British students and below those of Black African students. Very unfortunately the educational attainments of White Gypsy Roma and White Traveller of Irish Heritage students fall well below those of all other ethnic groups
Also, as will be indicated below, it is very important to note that in all ethnic groups, female students outperform male students and that students ineligible for free school meals outperform students eligible for free school meals although the attainment gap between pupils eligible and ineligible for free school meals is especially wide in the case of White British boys.
I shall first provide some data from Youth Cohort studies which give an indication of long term trends before concentrating in more detail on the most recent data
- YCS data giving an indication of long term trends from 1989-2004.
The following information is extracted from the Youth Cohort Study of 16 Year olds published in Feb 2005 and amended in June 2006. It illustrates trends in educational achievement at GCSE level [as measured by attainment of 5 or more GCSE grades A*-C in Year 11] between 1989 and 2004 according to the ethnicity of the students estimated on the basis of samples which range between 24922 and 13,698.
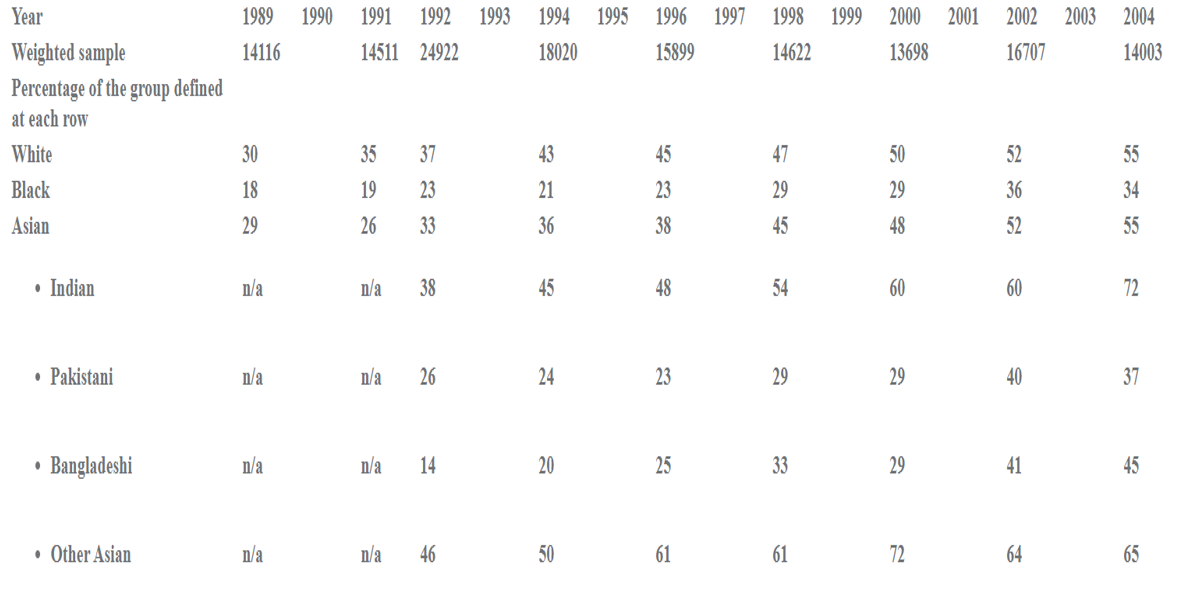
The above data indicate that the attainments of all ethnic groups listed have improved since between 1989 and 2004 but that significant ethnic inequalities in educational achievement remained in 2004 with Indian students performing better than White students and Black, Pakistani, and Bangladeshi students all performing significantly worse than White students. No separate data were available for Chinese students and there were no subdivisions made within the Black and White ethnic categories.
2 Data from a detailed academic paper by Professor Steve Strand
Students may click here for a detailed paper by Professor Steve Strand {Ethnicity, deprivation and educational achievement at age 16 in England ;trends over time .}. In this paper Professor Strand provides a clear comprehensive graphical description of relevant trends as well as detailed analysis. The charts and tables on pp40-50 provide the best description that I have seen of trends relating ethnicity, free school meal eligibility, gender and educational attainment at GCSE Level to 2015.
Most Recent Data on Key Stage 4 Ethnicity and Educational Attainment 2018/19- 2021/22
During the last 10-15 years there have been significant changes in the criteria used to assess student’ educational attainments at Key Stage 4 Level. A GCSE A* grade was introduced; pupil attainments were for several years assessed in terms of the proportions gaining 5 or More GCSE A*-C grades but this was then replaced by the proportions gaining 5 or more A*-C grades including English and Mathematics; then from 2018 major changes in assessment were introduced with the effects that nowadays ethnic differences in educational arraignment are assessed in terms of differences in proportions of students in different ethnic groups satisfying Attainment 8 criteria; passing GCSE English and Mathematics with Grades 5 or higher; and in terms of their entry rates and average points scores in EBacc subjects. These data are published by DfE each year initially in October and then revised and extended around February of the following Year.
Click here for Key Stage Performance Data for Academic Year 2021/22 published October 2022 and Click here for a direct link to very detailed data on Ethnicity and Key Stage 4 attainment.
- Grade assessments 2018/19- 2021/22 were heavily influenced by the cancellation of GCSE examinations in 2016/20 and 2020/21
- GCSE attainments are presented in terms of 4 Criteria: attainment of GCSE Grade 5 or above in English and Mathematics, entrance percentages in EBacc subjects, average Attainment 8 score, and average EBacc APS score per pupil.
- The ranking of ethnic groups according to these different criteria is similar but not identical.
- Chinese and Indian pupils’ GCSE attainment levels are considerably higher than those of all other ethnic groups.
- Bangladeshi and Black African pupils’ attainments were slightly better than those of White British pupils in 2021/22.
- Pakistani pupils’ attainments were slightly better on all 4 criteria than those of White British pupils in 2021/22 but not in earlier years.
- Afro-Caribbean pupils’ attainment levels have improved but they are lower than those of White British pupils and of Black African pupils.
- White Irish pupils perform well but unfortunately the attainment levels of White Gypsy Roma pupils and, White Traveller of Irish Heritage pupils are the lowest of all. The difficulties which these children face in pursuing their education have been discussed at a recent Select Committee meeting which is reported here by the BBC. Video coverage of the full Select Committee meeting can be accessed here
Key Stage 4: Ethnicity, Free School Meal Eligibility and Gender.
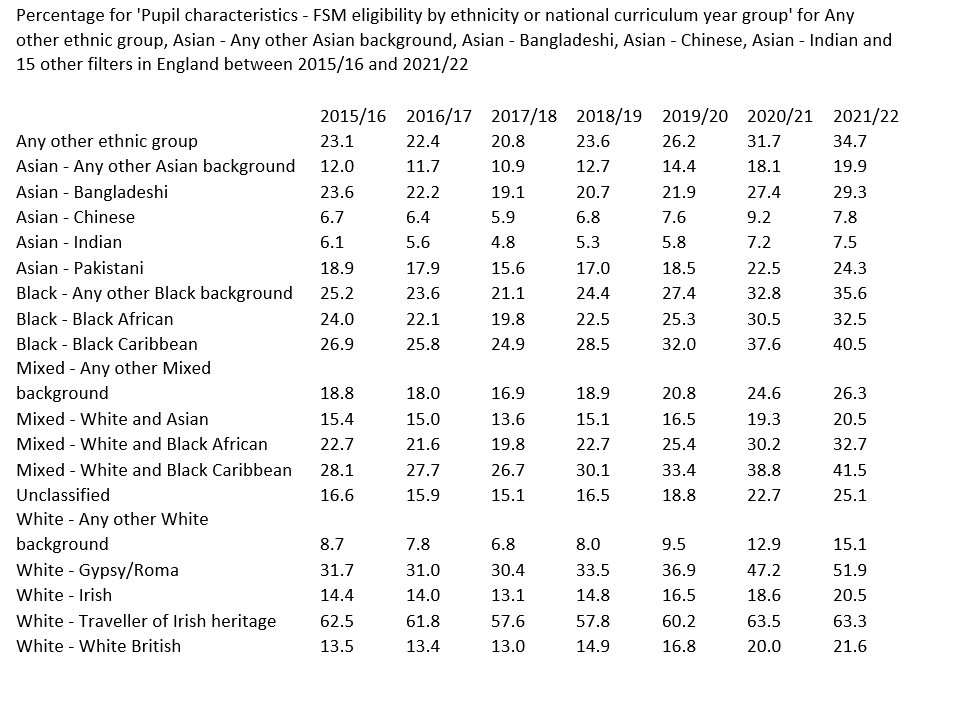
In their explanations of ethnic differences in educational achievement sociologists aim to assess the relative significance of material and cultural factors. We shall discuss these explanations presently but, in the meantime, it is important to note that one indicator of material disadvantage is eligibility for free school meals and the table below indicates that there are very significant ethnic differences in the proportions of pupils eligible for free school meals. Thus in 2021/22 whereas only 7.5% of Indian pupils and 7.8% of Chinese pupils were eligible for free school meals, these figures rose to 35.6%, 51.9% and 63.3% respectively for Black Caribbean pupils, White Gypsy Roma pupils and White Traveller of Irish Heritage pupils.
Update April 2023
Ethnicity, Gender, Free School Meal Eligibility and Attainment in England 2021/22
In an earlier version of this page I provided detailed information on Ethnicity, Gender, Free School Meal Eligibility and Attainment in England for years between 2018/19 and2020/21 but DfE data are now available for 2021/22 and students may prefer to concentrate on these most recent data. [ However, I have retained the earlier data in an appendix].
You may Click here for 2021/22 data on Ethnicity, Free School Meal Eligibility and Achievement at Key Stage 4 .and 7ou may also click here for 2021/22 data on Ethnicity, Gender and Achievement at Key Stage 4
Ethnicity, Gender, Free School Meal Eligibility and Attainment 8 Score of all pupils by ethnicity. England
Average Attainment 8 score 2021/22 England
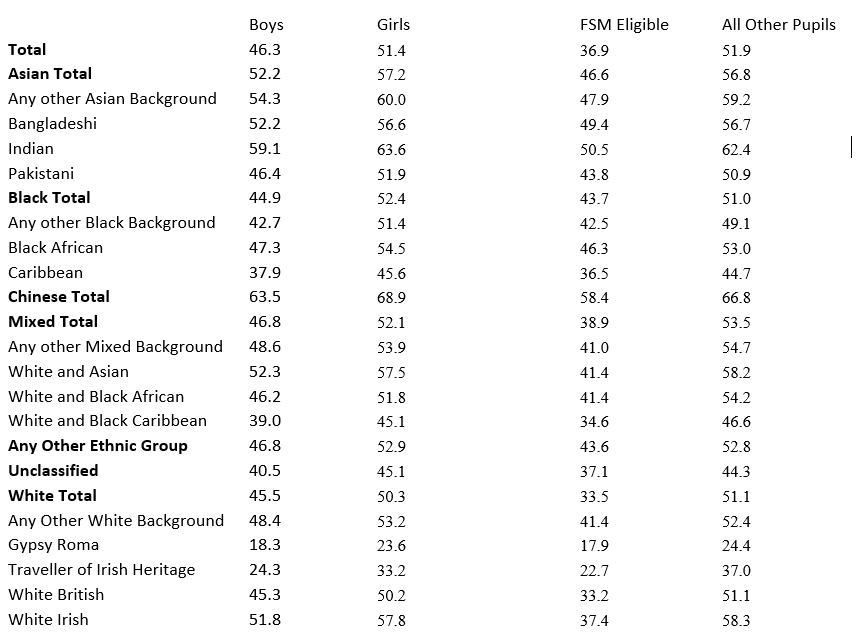
You may use the above table to answer the following questions.
- For all pupils what is the percentage gap in attainment between pupils eligible and ineligible for free school meals?
- In which broad ethic category is the gap in attainment between pupils eligible and ineligible for free school meals greatest?
- Comment on the free school meals attainment gap for Chinese pupils.
- Comment on the free school meals attainment gap for Indian pupils.
- Comment on the free school meals attainment gap for Bangladeshi pupils
- Comment on the free school meals attainment gap for Pakistani pupils.
- Comment on the free school meals attainment gap for Black African pupils.
- Comment on the free school meals attainment gap for Back Caribbean pupils.
- Comment of the free school meals attainment gap for White and White British pupils.
- Comment on the free school meals attainment gap for Gypsy Roma pupils.
- Comment on the free school meals attainment gap for Irish Traveller pupils.
Ethnicity and Gender
- You will also find that females outperform males in every ethnic category.
- The overall attainment gap between pupils eligible and ineligible for free school meals and pupils ineligible for free school meals is greater than the overall attainment gap between female and male pupils in every ethnic group.
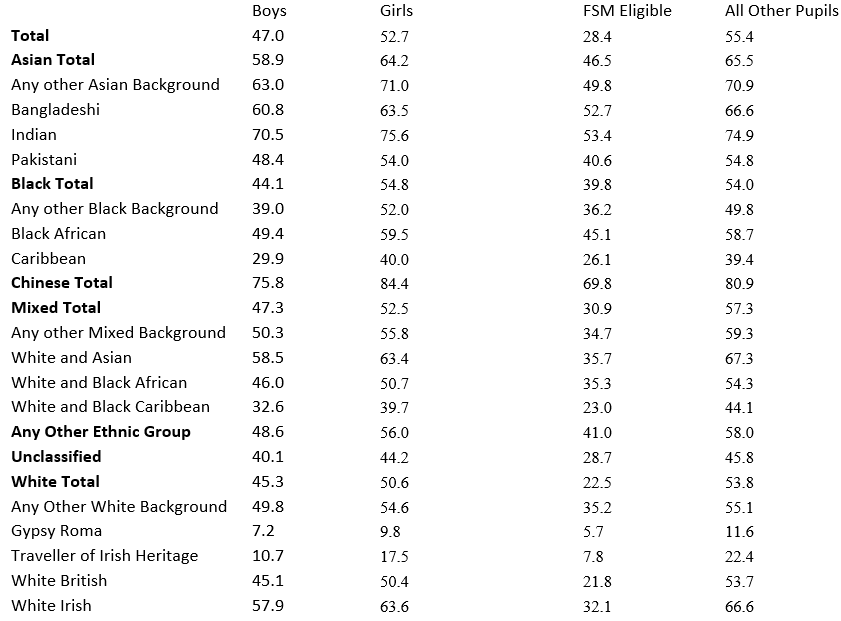
Ethnicity, Free School Meal Eligibility, Gender and percentages of pupils getting a grade 5 or above in English and maths GCSE in 2021/22 England
The overall patterns of attainment are very similar to those shown in the case of ethnic differences in Attainment 8 scores
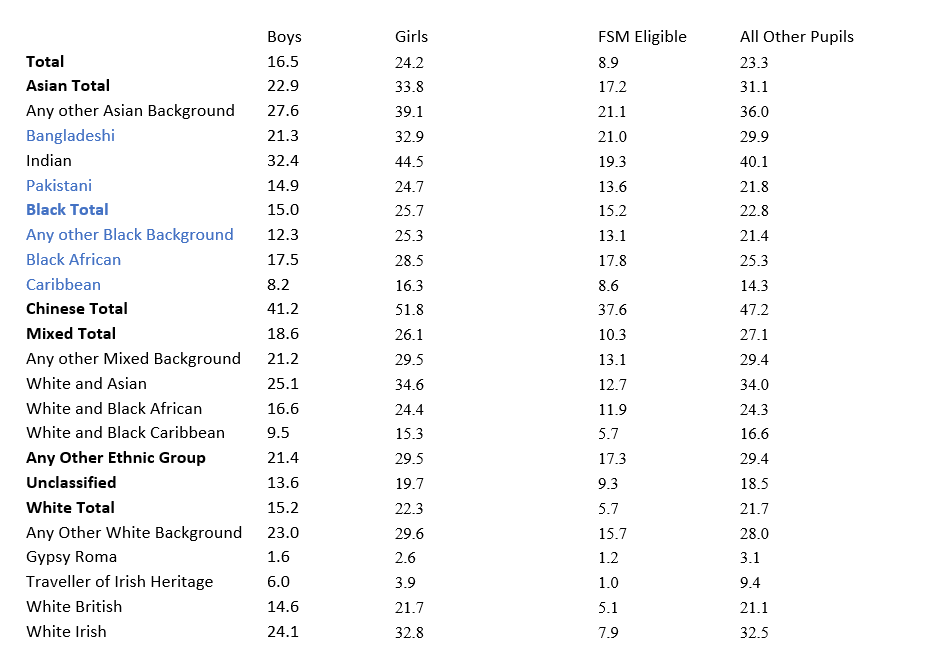
Ethnicity, Free School Meal Eligibility, Gender, and percentages of pupils getting grades 9-5 in EBACC subjects 2021/22 England.
In an earlier version of these teaching notes, I collated information on ethnic differences in the Gender gap and the FSM eligibility gap in attainment of Grades 9-5 in EBacc subjects in 2019. In the Pakistani, Bangladeshi, Black Caribbean, and Chinese ethnic groups the Gender Gap was greater than the FSM Eligibility Gap.
In the following table the data for 2021/22 indicate that in terms of the attainment of grades 9-5 in EBacc subjects for all pupils the Free School Meal Eligibility Gap was larger than the gender gap .However the FSM gaps were smaller than the Gender gaps for several ethnic groups [highlighted in Blue] when measured in terms of EBacc attainment because the specific FSM pupils enrolled on EBacc courses on average gained significantly better results relative to FSM ineligible pupils than the much larger number of FSM eligible pupils appearing in the Attainment 8 and GCSE English and Mathematics statistics achieved relative to FSM ineligible pupils.
Ethnicity and GCSE Results: Interim Conclusions
Sociologists have suggested three main types of explanation for the above relationships between ethnicity, free school meal eligibility and educational achievement.
- It is suggested that eligibility for free school meals is an imperfect measure of the relative economic deprivation suffered by pupils of different ethnic groups and that more accurate measures of economic deprivation would show that economic deprivation is a more important explanatory factor than the free school meals data suggest.[ As mentioned, several methods may be used to measure levels of economic deprivation but the comparison of these methods is technically complex and I shall not consider this point any further here. ]
- It is suggested that the differential educational achievements of different ethnic groups may be explained partly by a range of cultural factors operative for some ethnic groups so that some ethnic groups are more successful than others in overcoming the effects of material deprivation. It is widely believed that Indian and Chinese families are especially likely to value education highly and that these cultural attitudes enable poor Indian and Chinese students to offset more effectively the effects of poverty.
- Note that based on the above data the NFSM-FSM discrepancy is smaller in all ethnic minority groups than it is among white students.
- Others have is suggested that the cultural differences between ethnic groups have been much overstated and that instead a range of processes internal to the schools themselves may operate to the relative disadvantage of some ethnic groups rather than others. Thus, for example poor Afro-Caribbean students and poor white students may be more likely than poor Chinese and Indian students to experience negative labelling in schools.
- The fact that Also Black African students have higher levels of attainment than Black Afro-Caribbean students is sometimes considered to be evidence of the absence of racism within schools but the relatively lower attainment levels of Black Afro- Caribbean pupils may well be explicable to a considerable extent by the fact that they are more likely to be labelled negatively in schools.
- The gaps in attainment for white pupils eligible and ineligible for free school meals are greater than for any other ethnic group and this has generated considerable concern as to the prospects of white working class students although free school meal eligibility is a less than perfect measure of social class membership. This topic will be considered in more detail presently.
Section 3: Ethnicity and A Level Achievement
Very similar patterns of ethnic educational achievement continue at GCE Advanced Level and in BTec qualifications and there are consequently significant ethnic differences in access to higher education where entry rates are lowest for White Gypsy Roma, White Traveller of Irish Heritage, Afro-Caribbean and White British students.
Very similar patterns of ethnic educational achievement continue at GCE Advanced Level and in BTec qualifications and there are consequently significant ethnic differences in access to higher education where entry rates are lowest for White Gypsy Roma, White Traveller of Irish Heritage, Afro-Caribbean and White British students.
Click here for A Level and other 16-18 results 2020/21 and here for data on Ethnicity and A Level results 2020/21
Click here for data indicating that Chinese and Indian students are especially likely to achieve very good GCE Advanced Level Results in 2020/21
Click here for A Level and other 16-18 results 2021/22 and here for data on Ethnicity and A Level results 2021/22
Section 4: Ethnicity, Access to Higher Education and Degree Level Attainment
Ethnic patterns of access to Higher Education are similar to ethnic patterns of achievement at the earlier stages of education but if anything, the relatively low participation of White British and Afro-Caribbean pupils is even more marked. For example. we have noted that the GCSE attainments of White British and Pakistani pupils is very similar at GCSE Level, but Pakistanis are proportionately much more likely than White British pupils to access Higher Education although the situation is reversed in the caser of Pakistani and White British pupils not eligible for free school meals who progress to High Tariff HE. Bangladeshi and Black African Access to HE is also relatively high given their attainments at GCSE level
Click here for Widening Participation in Higher Education Academic Year 2020/21 [Scroll down to Free School Meals, Gender, and Ethnic Group.
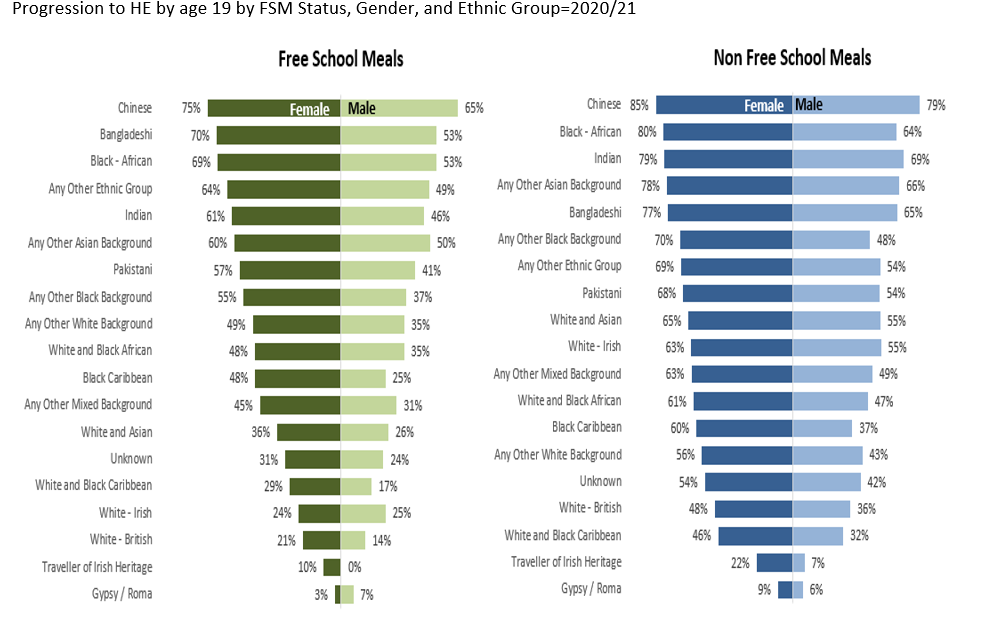
Click here for a table of the above data.
Progression to High Tariff HE
Progression rates to high tariff HE providers were highest for Chinese pupils regardless of gender or free school meal eligibility.
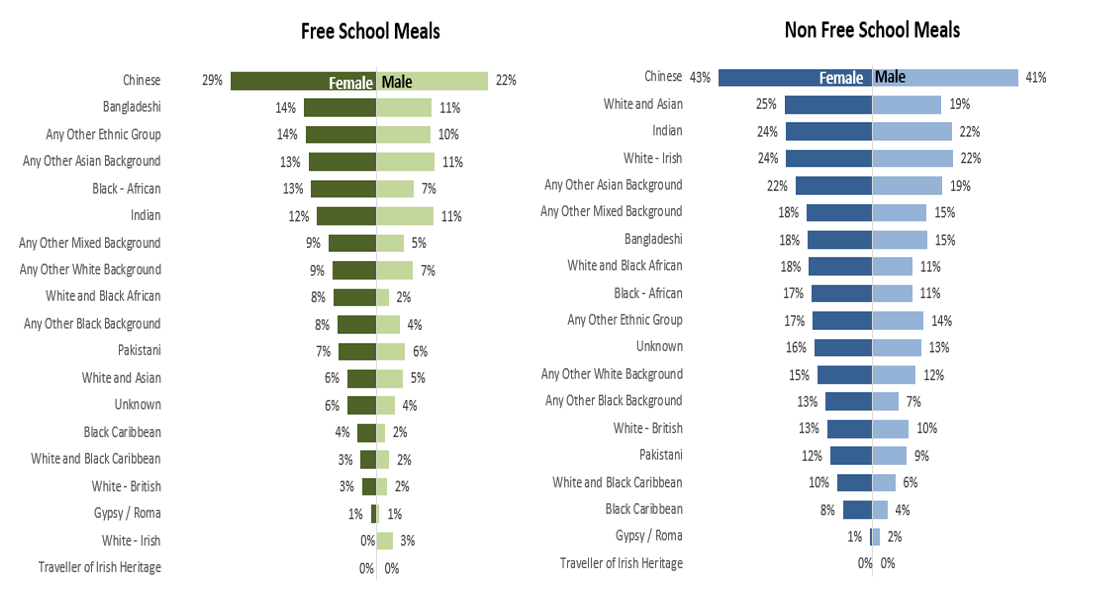
Click here for a table of the above data.
Ethnicity and Undergraduate Degree Results
You may click here to access recent data on ethnicity and degree classification. The data refer only to broad ethnic categories and the bracketed percentages refer to the percentages of graduates in each ethnic category who were awarded First Class degrees. Asian [33.3%]; Black [20.0%}; Mixed [35.6%]; White [39.4%]; Other [30.8%].
Further Sources
Click here for The Report of the Commission on Race and Ethnic Disparities
Click here and here for two Select Committee Reports on Education and White Working Class Pupils
For "Race" Section 3 - Click Here