Recent Trends in Educational Achievement: Social Class, Gender, and Ethnicity
In a previous version of this page, I provided some long-run data and more recent data on relationships between Social Class, Gender, and Ethnicity. IN this new page I concentrate only on the more recent data but if you wish to access long-run data you may still access the original page with the original long term data here.
Main Sources of Data
- Early years foundation stage profile results : 2023 to 2024
- Multiplication tables check attainment 2023/24
- Phonics screening check attainment
- Key Stage 2 National Headlines
- Key Stage 2 attainment
- Key Stage 4 statistics
- A Level and Other 16-18 Results
- Widening Participation in Higher Education
This is a March 2025 update of the page last updated in December 2024. The above links will enable readers to update the page for themselves in future years if they so wish using the Create Your Own Table Facility. [ The data are also revised once or twice per year!
I also use , JCQ data on GCSE and GCE Advanced Level Results, FFT educationdatalab blog, and HESA data on Higher Education. [Once you reach the JCQ site Click on Examination results, choose year and A Level or GCSE. Then choose A Level other results information or GCSE other results information and follow subsequent links]
Social Class and Educational Achievement
In recent years educational statistics have been published which indicate differences in educational achievement as between students eligible and ineligible for free school meals. Free school meal eligibility is a far from perfect measure of social class membership, but the statistics certainly do indicate that material deprivation has major effects on educational achievement.
Early Years, Key Stage 1 and Key Stage 2
- Early years foundation stage profile results : 2023 to 2024
- Multiplication tables check attainment 2023/24
- Phonics screening check attainment
- Key Stage 2 National Headlines 2023/24
- Key Stage 2 attainment 2023/24
Key Stage 4 Educational Attainment Levels 2018/19- 2022/23
Click here for Key Stage Four Performance 2023/24
Click here for FSM eligibility 2018/19- 2023/2024
Pupil attainments at Key Stage 4 are now assessed in terms of a variety of criteria as is indicated in the above table but on each criterion pupils on free school meals academic achievements are lower than those of all other students.
Click here for Sex Differences in Attainment at GCSE Level 2018/19- 2023/24
In this detailed table you will see a KS4 national characteristics summary from which from which I have extracted the following data on the FSM gap and the gender gap in educational achievement at KS4 .
FSM Eligibility, Gender, and Key Stage 4 Attainment Levels 2018/19- 2021/22: Average Attainment 8 scores and Percentages of Pupils Achieving Grades 4 or better and Grades 5 or better in English and Mathematics GCSEs
| FSM | FSM all other | Boys | Girls | |
| Average Attainment 8 score of all pupils 2018/19 | 34.9 | 48.6 | 44.0 | 49.5 |
| Average Attainment 8 score of all pupils 2021/22 | 36.9 | 51.9 | 46.3 | 51.4 |
| Average Attainment 8 score of all pupils 2023/24 | 34.6 | 49.5 | 43.7 | 48.2 |
| Percentage of pupils achieving Grade 4 or above in English and Maths GCSE 2018/19 | 41.4 | 69.4 | 61.0 | 68.4 |
| Percentage of pupils achieving Grade 4 or above in English and Maths GCSE 2021/22 | 47.0 | 74.5 | 66.2 | 71.5 |
| Percentage of pupils achieving Grade 4 or above in English and Maths GCSE 2023/24 | 43.3 | 71.9 | 62.5 | 67.6 |
| Percentage of pupils achieving Grade 5 or above in English and Maths GCSE 2018/19 | 22.5 | 46.6 | 40.0 | 46.6 |
| Percentage of pupils achieving Grade 5 or above in English and Maths GCSE 2021/22 | 28.4 | 55.4 | 47.0 | 52.7 |
| Percentage of pupils achieving Grade 5 or above in English and Maths GCSE 2023/24 | 25.9 | 52.3 | 43.6 | 48.3 |
Activity Using information in the above table on Gender, Free School Meal Eligibility and Educational Attainment answer the following questions.
- What was the Attainment 8 gap between FSM eligible pupils and all other pupils in 2023/24?
- What was the Attainment8 gap between girls and boys in 2023/24?
- What was the gap in achievement of Grade 5 or above in English and Maths GCSE in 2023/24 between FSM eligible and all other pupils?
- What was the gap in achievement of Grade 5 or above in English and Maths GCSE in 2023/24 between girls and boys?
- Which factor is the more significant influence on educational achievement: Gender or Free School Meal Eligibility?
A Level and other 16 to 18 results:
Click here for A level and other 16-18 results: 2025 and click here for a table on A Level results of students eligible and not eligible for free school meals. There is an attainment gap of approximately one half of a grade per A Level subject . Click here for similar data on disadvantaged and non- disadvantaged students.
Social Class and Higher Education
Click here for Widening Participation in Higher Education 2022/23 published November 24
This is a most excellent publication with superb charts and tables. You can create direct links to the information you require, and I have used this facility here.
Click here for FSM eligibility and Access to Higher Education and here for FSM eligibility and Access to Higher Education [High Tariff]
Click here and scroll down to Widening Participation for HESA data on UK domiciled full-time HE undergraduate student enrolments by participation characteristics:
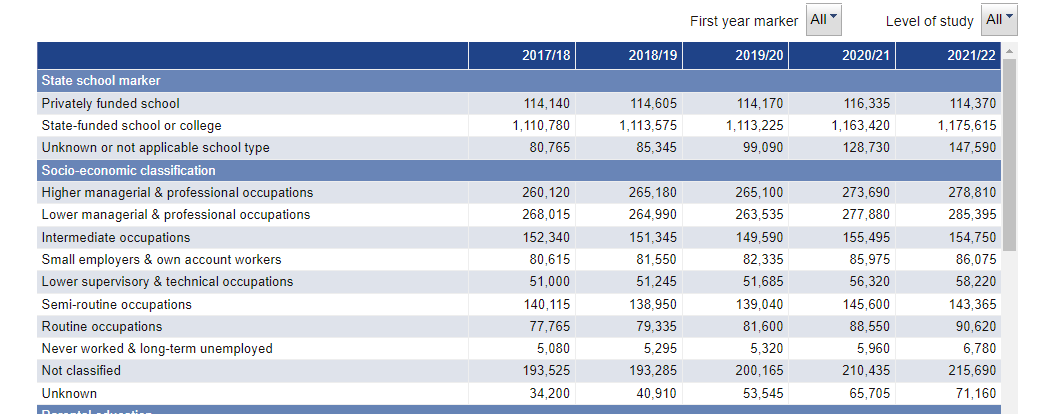
In the following table I have combined data from the 2021 Census [England and Wales] and from 2020/21HESA {UK]. Since the geographical coverage of the two sets of data differs and since the Census data also includes Students as a separate occupational category the two sets of data are not fully comparable, but they do give some indication of the relationships between parental social class and their children’s access to higher education.
| NS SEC Classification | Census 2021 [England and Wales | HESA Data 2020/21 [UK] |
| Higher managerial, administrative, and professional occupations | 13.1% | 25%. |
| Lower managerial, administrative, and professional occupations | 19.9% | 26% |
| Intermediate occupations | 11.4% | 14% |
| Small employers and own account workers | 10.6% | 8% |
| Lower supervisory and technical occupations | 5.4% | 8% |
| Semi-routine occupations | 11.4% | 13% |
| Routine occupations | 12.1% | 8% |
| Never worked and long term unemployed | 8.5% | 1% |
| Students | 7.7% |
Based on these data Children from NS Sec Classes One and Two are clearly over-represented in HE. No surprise there then!
Gender and Educational Achievement
Early Years, Key Stage 1 and Key Stage 2
- Early years foundation stage profile results : 2023 to 2024
- Multiplication tables check attainment 2023/24
- Phonics screening check attainment
- Key Stage 2 National Headlines 2023/24
- Key Stage 2 attainment 2023/24
Recent GCSE Results
The JCQ Presents full data on GCSE and GCE Advanced level entries and results subdivided by the separate countries of the UK, regions of England and the age and gender of candidates. However, data are not presented for candidates who do not identify as male or female.
Percentages of Male and Female Students and GCSE Examination Grades Cumulative Percentages UK 2016-2024.
You will see that comparing data for the years 2019 and 2024 the pass rates for English 16 year olds are slightly higher than for all UK students but that the gender gaps in each case are very similar or, indeed, identical.

UK data for all candidates of all ages indicate that females outperform males at GCSE level in terms of percentages of entrants gaining grades 7/A or above, Grades 4/C or above and grades 1/G and above. Approximately 85% of all UK GCSE candidates are English 16 year olds which means that UK and English results are likely to be quite similar and there is also a relatively small difference between the results of All UK entrants and the results of English 16 year olds as is indicated in the following table for the years of 2019 and 2023.
The table indicates that for all UK entrants the gender gap as measured by the percentages of entrants gaining grade 7/A or above was gradually narrowing prior to 2019 but that it widened when examinations were cancelled in 2020 and 2021 but then narrowed again once examinations were reintroduced in 2022 and 2023. This Guardian article notes that this was also the case for English 16 year olds and suggests that this shows that the cancellation of examination results slightly favoured female students and that the reintroduction of examinations slightly favoured male students.
However, the data in the above table also indicate that in terms of UK students of all ages attaining grades 4/C or above the gender gap narrowed when examinations were discontinued and continued to fall in 2022 but not 2023. You may also click here for an article from FFT educationdatalab scroll down about 70%] which in the section on Gender and GCSE results shows that for UK 16 year olds trends in the gender gap have varied depending upon whether one considers entrants gaining grades 7/A or higher or grades 4/C or higher. The devil, once again, appears to be in the detail.
However, in broad terms the Gender Gap for UK students has narrowed considerably between 2016 and 2023 and this is true whether it is measured in terms of grade 7/A and above or grade 4/C and above and the Guardian and FFT educationdatalab articles show that this is also the case for English and UK and 16 year olds.
Gender and Recent GCE Advanced Level Results UK 2010-2023

Click here for another useful source for Gender and Recent GCE Advanced Level Results.
Gender and Subject Choice at GCE Advanced Level
Click here for Gender and A Level Subject Choice: 10 most popular subjects.
Click here for Gender and A Level Subject Choice: STEM subjects.
GCE Advanced Level Examinations 2024: Some Related Media Coverage
Click here for baked in inequality within the English education system.
Click here for A Levels university costs and graduate earnings.
Click here for information on BTECs [BBC]
Click here for school exclusions.
Click here for A Levels top grades rise.
Click here for mismanagement of switch to T levels.
Click here for A Level students getting into first choice university.
Click here for university finance.
Click here for problems with university finances.
Click here for narrower range of A Level subjects chosen.
Gender and Higher Education
Click here for Widening Participation in Higher Education
Click here for Gender and Higher Education Progression Rate and here Gender and Higher Education Progression Rate [High Tariff]
Click here for HESA and scroll down to Personal Characteristics
In 2021/22 there were 1,284,370 females [59%], 891,900 males [41%] and 6,295] other students [0%] domiciled in the UK studying at all levels in UK universities. When Foreign domiciled students are included the statistics were1,633,425 females [57%] 1221,700 males [43%], and 7410 other students [0%]
There are significant gender differences in Higher Education Subject Choice as is shown in the following HESA data for 2021/22. [The data refer to all levels of study: i.e. to both undergraduate and postgraduate students. You may click here and scroll down to HE enrolments by subject of study for a more detailed breakdown.
| Subject | Female | Male | Other | Not known | Total |
| 01 Medicine and dentistry | 51,095 | 30,390 | 180 | 0 | 81,665 |
| 02 Subjects allied to medicine | 291,555 | 74,125 | 530 | 0 | 366,210 |
| 03 Biological and sport sciences | 58,155 | 59,030 | 325 | 0 | 117,505 |
| 04 Psychology | 114,000 | 25,975 | 450 | 0 | 140,425 |
| 05 Veterinary sciences | 10,035 | 2,070 | 40 | 0 | 12,145 |
| 06 Agriculture, food and related studies | 12,575 | 7,035 | 50 | 0 | 19,660 |
| 07 Physical sciences | 29,300 | 37,670 | 240 | 0 | 67,205 |
| 09 Mathematical sciences | 17,435 | 29,560 | 150 | 0 | 47,145 |
| 10 Engineering and technology | 37,965 | 147,455 | 300 | 0 | 185,725 |
| 11 Computing | 37,305 | 126,465 | 485 | 0 | 164,260 |
| 13 Architecture, building and planning | 24,410 | 39,105 | 95 | 0 | 63,610 |
| 26 Geography, earth and environmental studies (natural sciences) | 17,635 | 15,500 | 85 | 0 | 33,220 |
| Total science CAH level 1 | 701,460 | 594,385 | 2,920 | 0 | 1,298,765 |
| 15 Social sciences | 190,485 | 95,140 | 705 | 0 | 286,325 |
| 16 Law | 90,625 | 51,540 | 160 | 0 | 142,330 |
| 17 Business and management | 249,135 | 280,875 | 450 | 0 | 530,460 |
| 19 Language and area studies | 63,445 | 23,675 | 675 | 0 | 87,795 |
| 20 Historical, philosophical and religious studies | 45,940 | 36,705 | 435 | 0 | 83,085 |
| 22 Education and teaching | 105,660 | 30,005 | 290 | 0 | 135,960 |
| 23 Combined and general studies | 29,480 | 18,045 | 120 | 0 | 47,645 |
| 24 Media, journalism and communications | 28,980 | 18,950 | 205 | 0 | 48,135 |
| 25 Design, and creative and performing arts | 121,205 | 67,275 | 1,415 | 0 | 189,890 |
| 26 Geography, earth and environmental studies (social sciences) | 7,010 | 5,185 | 35 | 0 | 12,225 |
| Total non-science CAH level 1 | 931,965 | 627,395 | 4,490 | 0 | 1,563,850 |
| Total | 1,633,425 | 1,221,780 | 7,410 | 0 | 2,862,620 |
Ethnicity and Educational Achievement
In 2023 I produced a new separate document on Ethnicity and Educational Achievement Data which you may access here. Information is provided on ethnicity and school readiness and ethnicity and educational achievement at Key Stage 2, Key Stage 4, GCE Advanced Level and Higher Education Level. Interconnections between ethnicity, gender and free school meal eligibility are also considered in some detail.
GCSE and GCE Advanced Level Results: Different Types of School
Click here for Ofqual graphics on GCSE results in England by centre type and here for GCSE outcomes in England 2008- 2023 and here for regional data and more
Click here for Ofqual Graphics on GCE Advanced Level results by centre type.
Media Coverage of the 2023 GCE Advanced Level and GCSE Examinations
GCE Advanced Level Examinations
Click here for FFT educationdatalab which has very detailed coverage.
Click here for The Guardian A levels page.
Click here for response to GCE A Level results by Professor Lee Elliot Major
Click here for analysis of A Level results by Toby Helm [ with link to OFQUAL graphics]
Click here for the OFQUAL graphics
Click here for Disadvantaged students to bear brunt of grade deflation say experts.
Click here and here and here for BBC coverage but note that although females outperformed Males in A*/A grades, males outperformed females in A* grades in the UK
Click here for Channel 4 coverage [16 minutes]
GCSE Examinations
Click here and here for BBC coverage.
Click here for the Guardian GCSE page and here and here and here and here for more Guardian coverage.
Click here for FFT educationdatalab preamble to publication of GCSE results.
Click here for FFT educationdatalab detailed analysis of GCSE results.
Click here for Schools Week analysis
Click here for Observer article on examination results and the North- South divide 2023 [GCSE and A Level]