Appendix: Key Stage 4 Attainment Data 2018/19- 2020-/21
The following three tables provide Key Stage 4 data for various tears between 2018/19 and 2020/21. The patterns of attainment are very similar to those for 2021/22 although there are a few minor differences.
You may click here for detailed information on Ethnicity, Gender, Free School Meal Eligibility and Attainment 8 Score of all pupils by ethnicity
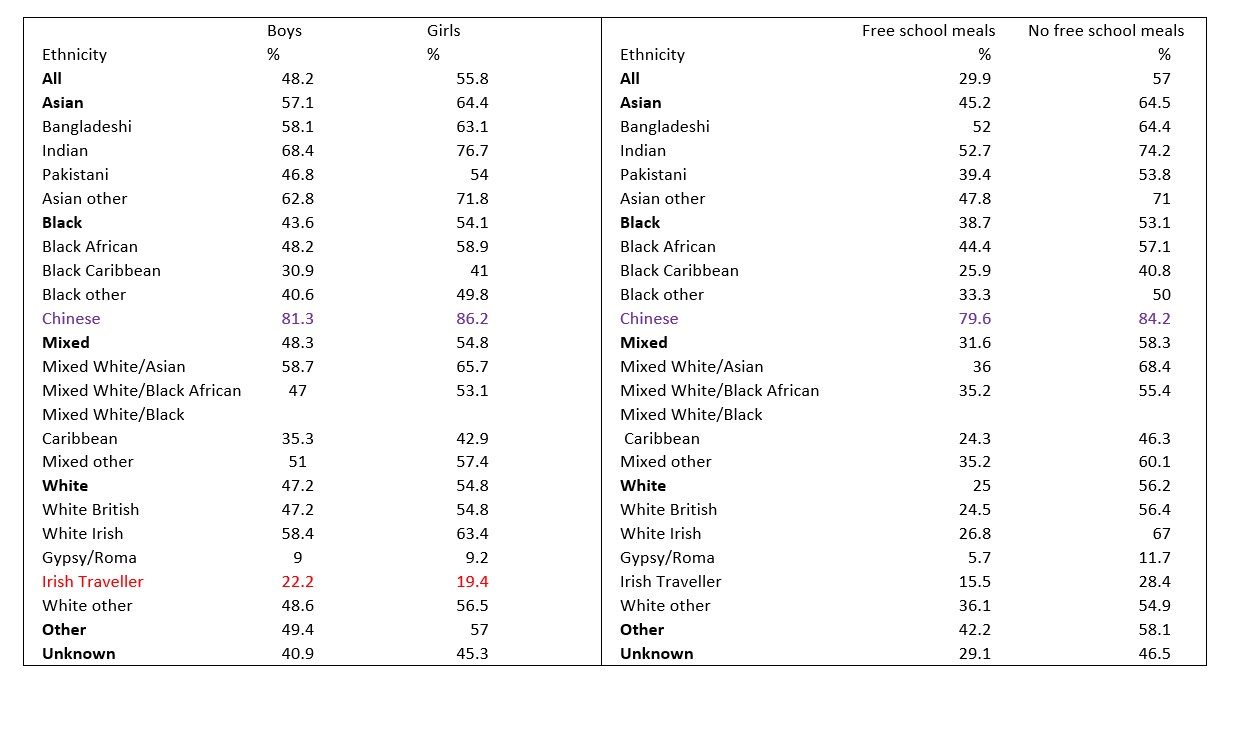
The above link provides a chart on Average Attainment 8 Score of all pupils by ethnicity but data is also provided on Average Attainment 8 Score, Ethnicity, gender and free school meal eligibility 2020-2021 I have tabulated here. You can easily compare the gender gaps and free school meal eligibility gaps for each ethnic group. What conclusions do you draw?

You may use the above table to answer the following questions
- For all pupils what is the percentage gap in attainment between pupils eligible and ineligible for free school meals?
- In which broad ethic category is the gap in attainment between pupils eligible and ineligible for free school meals greatest?
- Comment on the free school meals attainment gap for Chinese pupils.
- Comment on the free school meals attainment gap for Indian pupils.
- Comment on the free school meals attainment gap for Bangladeshi pupils
- Comment on the free school meals attainment gap for Pakistani pupils.
- Comment on the free school meals attainment gap for Black African pupils.
- Comment on the free school meals attainment gap for Back Caribbean pupils.
- Comment of the free school meals attainment gap for White and White British pupils.
- Comment on the free school meals attainment gap for Gypsy Roma pupils.
- Comment on the free school meals attainment gap for Irish Traveller pupils.
Ethnicity and Gender
- You will also find that females outperform males in every ethnic category.
- The overall attainment gap between pupils eligible and ineligible for free school meals and pupils ineligible for free school meals is greater than the overall attainment gap between female and male pupils in every ethnic group apart from the Chinese ethnic group.
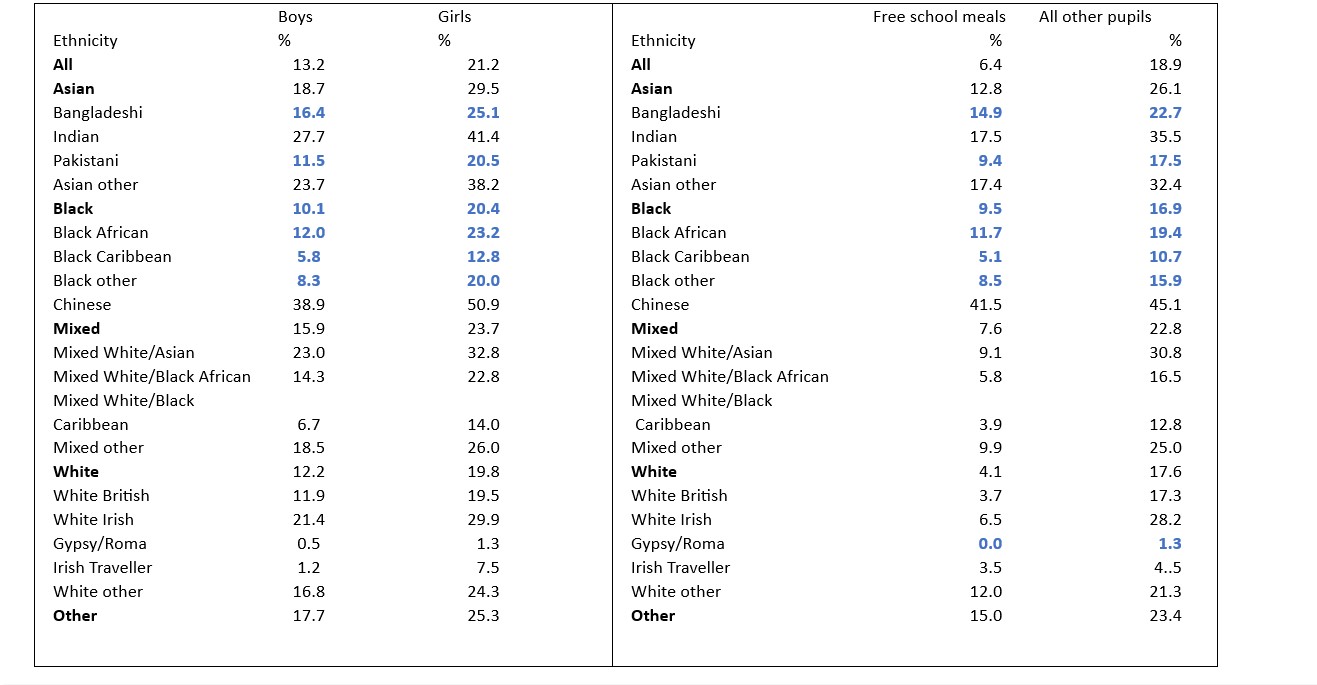
Ethnicity, Free School Meal Eligibility, Gender and percentages of pupils getting a grade 5 or above in English and maths GCSE in 2020/21
The overall patterns of attainment are very similar to those shown in the case of ethnic differences in Attainment 8 scores. Again, the Chinese are the exception to the rule and Irish Traveller boys outperform Irish Traveller Girls in English and Mathematics
Click here and here for percentages of pupils getting a grade 5 or above in English and maths GCSE in 2020/21 by ethnicity and gender and by ethnicity and free school meal eligibility. The Charts provide information on broad ethnic categories but there is also information on more detailed ethnic categories for 2020-2021 which I have tabulated here. Notice the Data on Chinese and Irish Traveller pupils.
In an earlier version of these teaching notes, I collated information on ethnic differences in the Gender gap and the FSM eligibility gap in attainment of Grades 9-5 in EBacc subjects in 2019. In the Pakistani, Bangladeshi, Black Caribbean, and Chinese ethnic groups the Gender Gap was greater than the FSM Eligibility Gap.
In the following table the data for 2018/9 indicate that in terms of the attainment of grades 9-5 in EBacc subjects for all pupils the Free School Meal Eligibility Gap was slightly larger than the gender gap .However the FSM gaps were smaller than the Gender gaps for several ethnic groups [highlighted in Blue] when measured in terms of EBacc attainment because the specific FSM pupils enrolled on EBacc courses on average gained significantly better results relative to FSM ineligible pupils than the much larger number of FSM eligible pupils appearing in the Attainment 8 and GCSE English and Mathematics statistics achieved relative to FSM ineligible pupils. [ You may also Click here and then on National Characteristics Tables and then on CH2 for the 2019 data source from which the following table is derived]
Ethnicity, Free School Meal Eligibility, Gender, and percentages of pupils getting grades 9-5 in EBACC subjects 2019.
In this table the Free School Meals data refers to pupils known to be eligible for free school meals. Some pupils who are eligible for Free School meals may appear in the “All other pupils” category.
Ethnicity and GCSE Results: Interim Conclusions
Sociologists have suggested three main types of explanation for the above relationships between ethnicity, free school meal eligibility and educational achievement.
- It is suggested that eligibility for free school meals is an imperfect measure of the relative economic deprivation suffered by pupils of different ethnic groups and that more accurate measures of economic deprivation would show that economic deprivation is a more important explanatory factor than the free school meals data suggest.[ As mentioned, several methods may be used to measure levels of economic deprivation but the comparison of these methods is technically complex and I shall not consider this point any further here. ]
- It is suggested that the differential educational achievements of different ethnic groups may be explained partly by a range of cultural factors operative for some ethnic groups so that some ethnic groups are more successful than others in overcoming the effects of material deprivation. It is widely believed that Indian and Chinese families are especially likely to value education highly and that these cultural attitudes enable poor Indian and Chinese students to offset more effectively the effects of poverty.
- Note that based on the above data the NFSM-FSM discrepancy is smaller in all ethnic minority groups than it is among white students.
- Others have is suggested that the cultural differences between ethnic groups have been much overstated and that instead a range of processes internal to the schools themselves may operate to the relative disadvantage of some ethnic groups rather than others. Thus, for example poor Afro-Caribbean students and poor white students may be more likely than poor Chinese and Indian students to experience negative labelling in schools.
- The fact that Also Black African students have higher levels of attainment than Black Afro-Caribbean students is sometimes considered to be evidence of the absence of racism within schools but the relatively lower attainment levels of Black Afro- Caribbean pupils may well be explicable to a considerable extent by the fact that they are more likely to be labelled negatively in schools.
- The gaps in attainment for white pupils eligible and ineligible for free school meals are greater than for any other ethnic group and this has generated considerable concern as to the prospects of white working class students although free school meal eligibility is a less than perfect measure of social class membership. This topic will be considered in more detail presently.