The UK General Election of May 6th, 2010 Sections List:
Section 1: Introductory Links - Click Here
Section 2: Parties, Poll Data, Events and Debates - Click Here
Introduction: Aspects of British Party Politics 2005-2010
Opinion Poll Data and Some Major Political Events 2005-2010
The Leadership Debates
Section 3: The General Election of 2010: Data
The Result of the UK General Election of 2010
Tactical Voting [External links only at present]
Social Influences on Voting Behaviour
Social Influences on Turnout [Added April 2012]
The Mass Media and Voting Behaviour [External links only at present]
Section 4: The General Election of 2010: Data - Click Here
Party Identification and Voting Behaviour
The Influence of Salient Issues and Party Policies
Party Images and Voting Behaviour
Valence Issues: The Importance of Political Leadership
The Parliamentary Expenses Scandal
Section 5: Summary: The UK General Election of May 6th, 2010 - Click Here
Section 3:
The General Election of 2010: Data
The Result of the UK 2010 General Election with some Comparisons
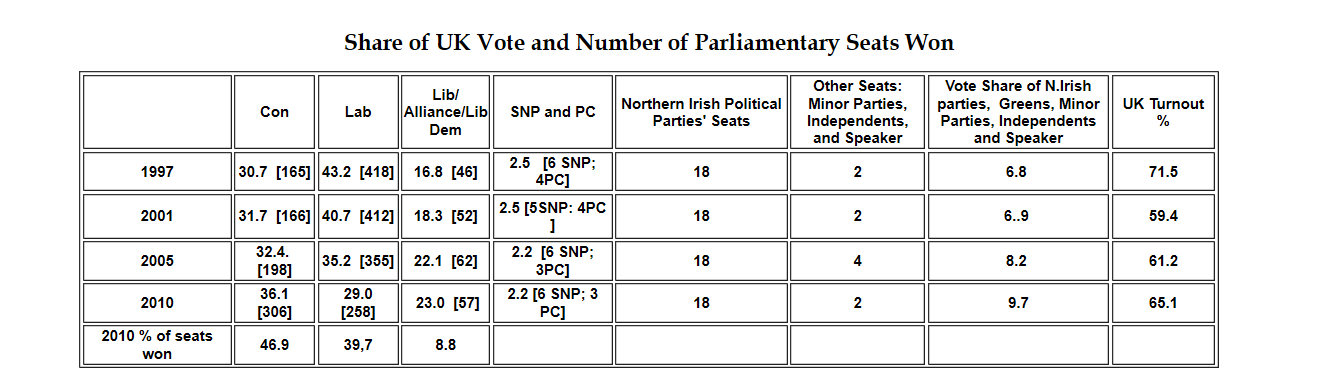
Note. In 2010 the combined % share of the vote of the SNP, PC, N.Irish Parties, Minor Parties, Independents and the Speaker was 11.9% and their combined % seat share was 4.6%
Click here for more detailed results of the 2010 General Election from the BBC which includes detailed information on votes cast for the minor parties.
- The above statistics have been collated from House of Commons Research Papers on the 1997, 2001, 2005 and 2010 General Elections. They treat the Speaker as separate from the political party to which s/he actually belongs .
- The Butler swing from Labour to Conservative is defined as the average of the % Conservative gain and the % Labour loss between two General Elections and it was estimated that the Conservatives would require a uniform nation swing of 7% between 2005 and 2010 for them to secure an overall Parliamentary in 2010 General Election although they could still win with a smaller national swing if they nevertheless achieved 7% swings in sufficient marginal constituencies to bring them overall victory. It has been rare in UK post- war General Elections for any party to achieve a national swing as great as 7% and in 2010 the national swing to the Conservatives was 5.0% and they did not perform well enough in marginal seats to win an overall Parliamentary majority.
- Thus 2010 the Conservatives polled the largest number of votes and gained the largest number of seat but not enough seats to form a single party majority government. Consequently a Coalition Government between the Conservatives and Liberal Democrats was formed.
- Once again the lack of proportionality of the First Past the Post electoral system was abundantly clear: the system discriminated especially against the Liberal Democrats.
- However the system also harmed the Conservative Party in the sense that whereas in 2005 Labour had secured a workable House of Commons majority with 35.2%of the votes cast the Conservatives were unable to do so in 2010 despite gaining 36.1% of the votes cast.
- Further information on important aspects of the 2010 General Election result can be found in Electoral Reform Society publications .
- Click here for a Radio 4 programme on bias in the UK electoral system.
- Labour's vote share at 29% indicated that this was clearly a very poor result for them [only 1.4% better than in 1983] but the operation of the electoral system helped them to retain 258 seats : many more than the Conservatives retained in 1997 and 2001 despite gaining 31.5% and 31.7% respectively of the votes cast.
- Labour's share of the vote was its second lowest since 1918 [only 1983 was lower] and so clearly Labour has much to do if it is to recover the share of the vote which it achieved in 1997.
- You may click on the following links for BBC coverage of the General Election results in Northern Ireland, Scotland and Wales respectively. You may also click here for a concise BBC item comparing voting trends in England, Scotland and Wales and here for some further analysis from the BBC of the General Election in Wales .
- Measured as a proportion of the total Great Britain vote the UK Independence Party vote share increased from 2.3% to 3.2% between 2005 and 2010; the BNP vote share increased from 0.7% to 1.9%; and the Green vote fell from1.1% to 1% although the Greens did win one seat , Brighton Pavilion, where Caroline Lucas, the leader of the Green party, was victorious. UKIP, the BNP and the Greens gained much smaller shares of the vote in the 2010 General Election than in the European Parliament Elections of 2009 when the Parliamentary Expenses Scandal was at its height. However it is important to try to assess the extent to which UKIP votes may have led to reduced Conservative support. I shall include some information on this in the near future.
- You may click here for BBC coverage of the June 2009 European Parliament Election Results
Click here for Guardian coverage of estimates of outcomes of the 2010 General Election under alternative electoral systems
Tactical Voting: External Links Only
I hope to provide information on Tactical Voting in the near future. Meanwhile I hope that you will find the following links useful
Click here and here and here for BBC items on tactical voting
Click here for long term trends in tactical voting from Ipsos MoriXXX
- Social Influences on Voting Behaviour
I am extremely grateful to IPSOS MORI for permission to use the following data. IPSOS MORI are not responsible in any way for the conclusions which I have drawn from the data.
- Some Comparisons between long -term relationships between social class and voting behaviour and those that occurred in the 2010 General Election.
Click here and follow links for Ipsos Mori data on How Britain Voted in 2010 and in all General Elections since 1974
Click Here and Here and scroll down for Ipsos Mori Political Monitor and Issue Index at the time of the 2010 General Election and for more recent editions Click here for long term trends in the relative importance of different political issues.
Click here and scroll down for Ipsos Mori April 2015 Issues Index and Election Special. The latter has good information on Best Party on Key Issues at the time of 2015 General Election and previous General Elections including the 2010 General Election .
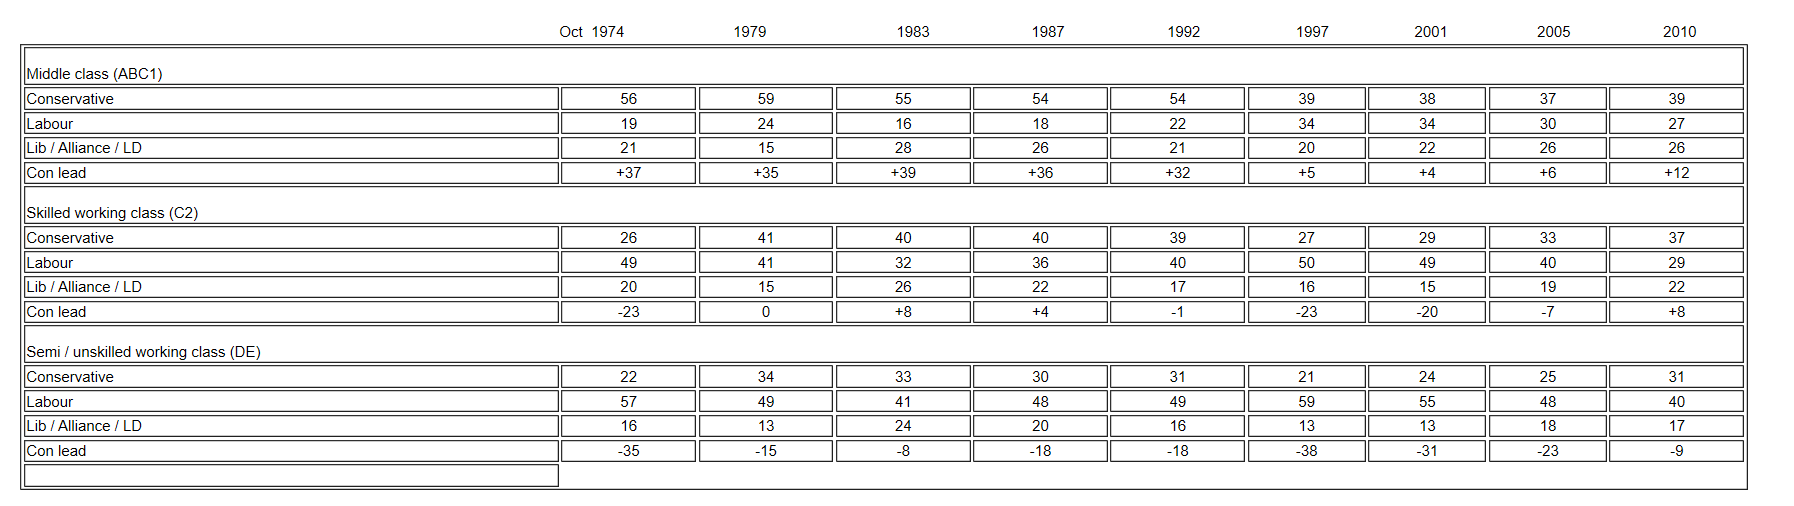
- The measurement of class voting presents considerable problems which have been dealt with elsewhere but it is now generally agreed that there have been long term declines in both partisan and class dealignment.
- It is difficult to summarise all of the relationships in the above table but essentially we see a significant decline in Labour's popularity between OCT 74 and 1983 followed by a gradual recovery under Neil Kinnock's leadership between 1983 and 1992 and significant improvement under Tony Blair in 1997. Labour's popularity was maintained between 1997 and 2001 but declined significantly between 2001 and 2005.
- In the Blair era it is notable that in 1997 and 2001 working class support for labour increased significantly but the increase in middle class support for Labour was even greater suggesting an overall decline in class voting between 1992 and 2001.
- In 2005 the decline in working class support for Labour was greater than the decline in middle class support for Labour suggesting a further small overall decline in class voting.
- In 2010 the decline in working class support for Labour was again greater than the decline in middle class support for Labour suggesting further class dealignment between 2005 and 2010.
- As will be indicated below the patterns of support for Conservative, Labour and Liberal Democrat parties among AB, C1 and C2 voters were almost identical so that for these social classes the effect of social class on voting behaviour had virtually disappeared although DE voters remained quite significantly more likely to vote Labour and less likely to vote Conservative than AB, C1 and C2 voters. This is a very important point which students should emphasise in any answers to questions on the changing relationships between social class and voting behaviour.
Social Influences on Voting Behaviour in the General Election of 2010
Social Class and Voting Behaviour
Click here and follow links for Ipsos Mori data on How Britain Voted in 2010 and in all General Elections since 1974
Click here for YouGov 2010 Survey for the Sun Newspaper [Fieldwork 2nd-3rd May] and Click here for a YouGov 2010 Survey for the Sun Newspaper [Fieldwork 4th -5th May]
Students should consult the original poll data for very detailed information on voting intentions in the 2010 General Election. For obvious reasons we should not expect the results from these polls to be identical but they do each illustrate the continuing weakening of the relationships between voting behaviour and social class .
Firstly let us consider the Ipsos Mori estimates of the relationships between social class and voting behaviour where separate data are provided for Social Classes AB, C1, C2 and DE
Social Class and Voting Behaviour 2010 {Percentage changes since 2005 are in brackets] : Ipsos Mori Data]
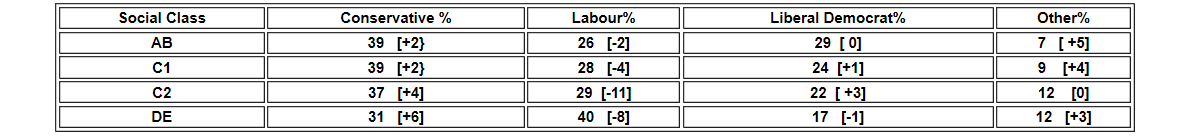
On the basis of these data we may note the following points in relation to relationships between social class and voting behaviour in 2010.
- Between 2005 and 2010 the swing to from Labour to Conservative was much smaller among AB and C1 voters than among C2 and DE voters.
- Whereas Labour lost 2% of its AB support ad 4% of its C1 support it lost 11% of its C2 support and 8% of its DE support.
- Correspondingly the increase in Conservative support was smaller among AB voters [2%] and C1 voters [2%] than among C2 voters [4%] and DE voters [6%].war General Elections.
- Among Social Classes AB, C1 and C2 patterns of voting behaviour were very similar .That is: among social classes AB, C1 and C2 class voting virtually disappeared in 2010 and the well known statement from Peter Pulzer in the 1960s that "Class is the basis of British Politics: all else is embellishment and detail." which had become decreasingly accurate since the 1970s certainly does not describe the patterns of voting behaviour which occurred in 2010.
- However DE voters were still 9% more likely to vote Labour than to vote Conservative and this means that although the relationship between social class and voting behaviour did weaken considerably between 2005 and 2010 working class voters as a whole were still slightly more likely to vote Labour and less likely to vote Conservative than were middle class voters . However this was a very far cry from the high point of class voting in the early 1950s.
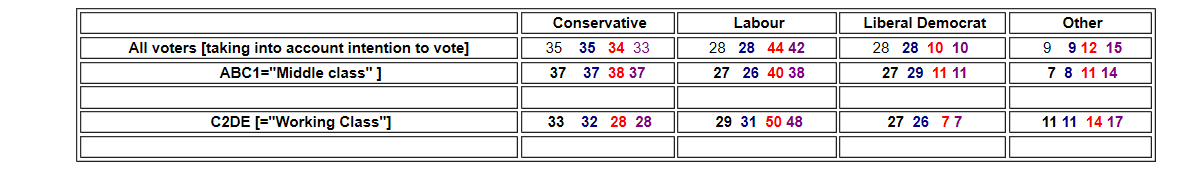
Let us now turn to the findings of two You Gov surveys: Click here for YouGov 2010 Survey for the Sun Newspaper [Fieldwork 2nd-3rd May] and Click here for a YouGov 2010 Survey for the Sun Newspaper [Fieldwork 4th -5th May]
]Social Class and Voting Behaviour 2010 {Data for 2nd-3rd May = Black: Data for 4th-5th May = Blue You Gov Data]. Differences in the two sets of data as expected are very small

- Data from YouGov surveys differ from Ipsos Mori data in that YouGov data distinguish only between classes ABC1 [="the middle class] and C2DE [=the working class] .
- These data indicate that social class differences in voting behaviour in 2010 were very small: thus taking the data for the 4th-5th May ABC1 voters were 5% more likely than C2DE voters to vote Conservative and that C2DE voters were 5% more likely than ABC1 voters to vote Labour. To reiterate : these are very small social class differences in voting behaviour.
As is pointed out in both "Explaining Cameron's Coalition[2011] by R. Worcester, R. Mortimore, P. Baines and M .Gill [pp 280-282] and by Peter Kellner in his article* in Reassessing New Labour [2011 edited by Patrick Diamond and Michael Kenny it is especially important to note also that as a result of the combined effects of changes in the UK class structure which resulted in increased and reduced relative sizes of the middle class and working class respectively, social class differences in turnout [AB and C1 individuals are more likely to vote than C2 and DE individuals] and the significant decline in C2 and DE support for Labour the Labour Party actually received more middle class votes than working class votes. in 2010 . This is a very important point which students should emphasise in any answers to questions on the changing relationships between social class and voting behaviour . [Peter Kellner's article is entitled "The Death of Class-Based Politics." Click here for a Guardian article by Peter Kellner in which he analyses the relationship between social class and support for the Labour Party.]
Addendum March and November 2012
Social class differences in voting intention were clearly small at the 2010 General Election but parties' overall opinion poll ratings and relationships between social class and voting behaviour are also often volatile between General Elections. In the following table the above YouGov data [in Black and BLUE] from two May 2010 surveys are repeated but the RED data refer to the findings of a You Gov survey based on fieldwork March 27-28 2012 [following the March 2012 Budget and controversy around Conservative Party funding] for the the Sun Newspaper and the PURPLE data refer to findings of a You Gov survey based on fieldwork 19th-20th November. Of course these large Labour leads in the more recent polls may be temporary
Click here for the You Gov Survey based on fieldwork March 27-28 2012 for the the Sun Newspaper . Data from this survey appear in RED. Click here for the You Gov Survey based on fieldwork 19th-20th November for the Sun Newspaper . Data from this survey appear in PURPLE
On the basis of these survey:
- Between May 2010 and March 2012support for the Conservatives among the ABC1 voters has risen slightly [by1%] and fallen a little more among C2DE voters [by 4%].
- There have been substantial increases in Labour support among ABC1voters [14%] and among C2DE voters [19%] in both cases at the expense of the Liberal Democrats.
- C2DE voters are significantly more likely to vote Labour than to vote Conservative suggesting that the "Death of Class Politics" [see above] may not yet have occurred .
- However ABC1 voters are also very slightly more likely to vote Labour than to vote Conservative which is a far cry from the heyday of very strong middle class support for the Conservative Party.
- Changes between March2012 and November 2012 have been small although we should note the increased support among ABC1 and C2DE voters for other parties mainly increased support for UKIP.
Addendum January 2013
Students will be aware that researchers involved in successive British Election Studies have preferred to analyse relationships between social class and voting behaviour using their own social class schema rather than the schema used in both Ipsos Mori and You Gov surveys. In their study Elections and Voters in Britain [2012] David Denver, Christopher Carman and Robert Johns present data on relationships between voting behaviour social class in recent General Elections as well as long term trends in class dealignment calculated from BES survey data. Since differing measures of social class are adopted some differences in findings as between the Ipsos Mori and You Gov data and the BES data are clearly to be expected although clear evidence of class dealignment is provided in each case. You may consult Elections and Voters in Britain [2012] for more detailed information on the BES survey data.
- Gender and Voting Behaviour
I have modified this section of the notes to take account of differences in the definition and measurement of the gender gap and to include some information on the effects of inter-relationships between gender, age and social class on voting behaviour. In this latest revision of this section I now rely primarily on the IPSOS MORI data on gender and voting behaviour which can be found on the IPSOS MORI site and also in successive IPSOS MORI studies of the General Elections of 1997, 2001, 2005 and 2010.
The measurement of the gender gap can present some problems but students may find the IPSOS MORI summary presentation of the data
especially useful especially for examination purposes.
You may also for click here for BBC Programme [about 25 minutes] on Gender and Voting Behaviour.
- This section of the notes now divided into four parts.
- The Basic Trends in the Relationships between Gender and Voting Behaviour 1974 [Oct] -2010.
- Data on Gender and Voting Behaviour 1974 [Oct] - 2001
- Data on Gender and Voting Behaviour in 2005 and 2010.
- Some Further Information [via external links ] on Gender and Voting Behaviour in 2010.
- The Basic Trends in the Relationships between Gender and Voting Behaviour 1974 [Oct] -2010.
- The gender Gap may be calculated in two different ways; The Female- Male- Gender Gap in Conservative Voting and the Male -Female Gender gap in Conservative voting. These gaps have the same values but with different signs. This seems clear enough but by analogy if you imagine two individuals X and Y who weigh 15 stone and 11stone respectively the X-Y "weight gap" is 4 stone and the Y-X "weight gap" is -4stone. [In principle similar gender gaps in Labour voting could also be calculated]
- The Female-Male Gender gap is calculated as [% Female Con Vote- % Female Lab Vote] minus [% Male Con Vote -% Male Lab Vote].
- The Male-Female Gender Gap is Calculated as [% Male Con Vote- % Male Lab Vote] minus [% Female Con Vote- % Female Lab Vote].
- On the basis of the IPSOS MORI data [see below] the Female-Male Gender Gap changed from +12 to -5 between 1974[Oct] and 2010 illustrating that between these dates women became decreasingly pro-Conservative/increasingly pro-Labour by comparison with men.
- Analogously the Male-Female Gender Gap changed from -12 to +5 indicating that between these dates men became increasingly pro-Conservative/ decreasingly pro-Labour by comparison with women.
- However IPSOS MORI present these data slightly differently noting that there was a positive Female-Male Gender Gap between 1974 [Oct] and 2001 and a positive Male-Female Gender Gap in 2005 and 2010 [See Below].
- There are also important interconnections between gender, age and voting behaviour. Between 1974[Oct ] and 2001 even though the overall positive gender gap indicated that women overall were relatively pro-Conservative/ anti Labour by comparison with men negative Female-Male Gender Gaps among younger voters indicated that young women were less pro- Conservative/more pro-Labour than young men.
- As noted in point 6 IPSOS MORI present the 2005 and 2010 data as indicating a Positive Male-Female Gap .
- This positive Male-Female gender gap was even greater among voters 18-24 and 25-34 in 2005 and among voters 25-34 [but not 18-24] in 2010 indicating that male voters in these age groups at these times were specially pro-Conservative /anti-Labour by comparison with female voters in these age groups.
- There are also important interconnections between gender, social class and voting behaviour. These are illustrated below.
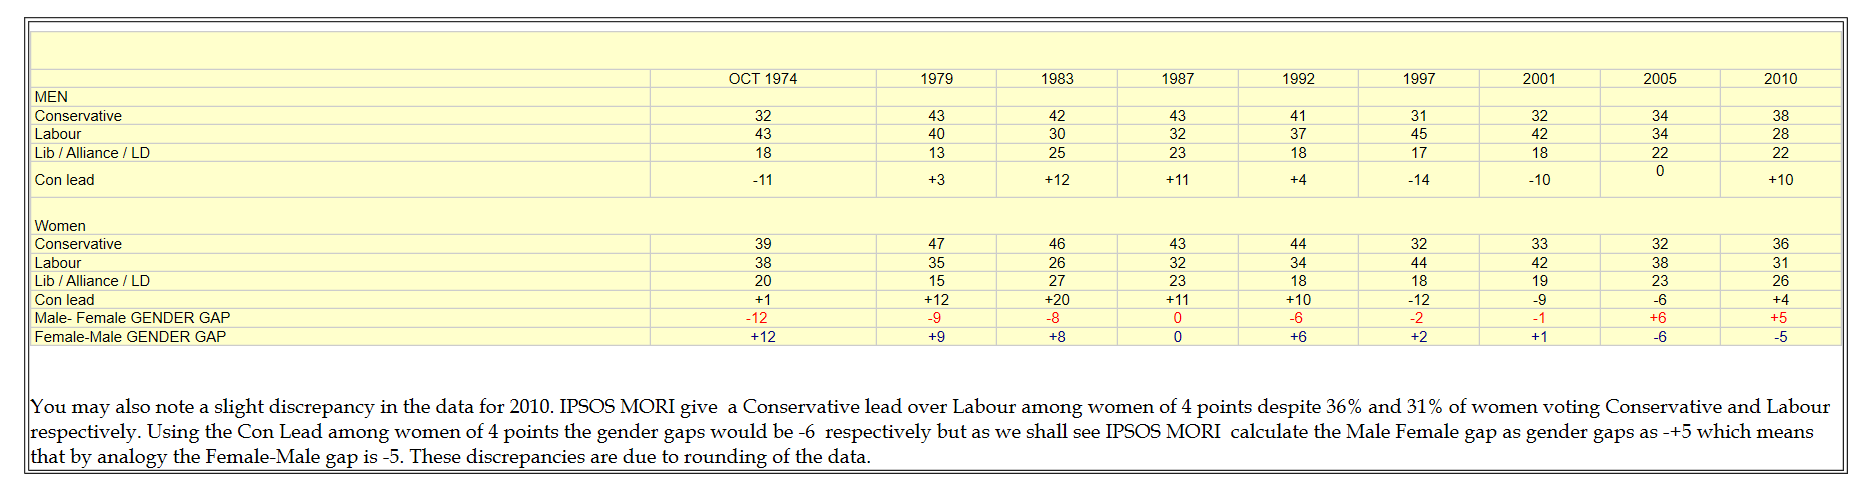
The Full IPSOS MORI Data are presented below. However calculations of the male-female and female-male gender gaps do not appear in the original IPSOS MORI Table and I have calculated these below Essentially the following RED figures illustrate trends in the male-female gap in voting behaviour and the following BLUE figures illustrate trends in the female -male gap in voting behaviour . It is numerically inevitable that for each year the figures for the two types of gender gap are identical but with different signs.
|
You may also note a slight discrepancy in the data for 2010. IPSOS MORI give a Conservative lead over Labour among women of 4 points despite 36% and 31% of women voting Conservative and Labour respectively. Using the Con Lead among women of 4 points the gender gaps would be -6 respectively but as we shall see IPSOS MORI calculate the Male Female gap as gender gaps as -+5 which means that by analogy the Female-Male gap is -5. These discrepancies are due to rounding of the data. |
With regard to the data on the Female-Male Gender Gap we see that this has usually been positive from OCT 1974 to 2001 [although zero in 1987] and that it has been negative in 2005 and 2010. Thus the initially positive Female-Male Gender Gap is a measure of women's traditional relative Pro-Conservatism/ anti-Labourism and the more recent negative Female -Male Gender Gap illustrates Females recent relative Pro-Labourism/anti-Conservatism.
Analogously the Male-Female Gender Gap trend from negative to positive illustrates a shift from relative Male anti-Conservatism/Pro-Labourism to relative Male pro-Conservatism/anti-Labourism.
2 Recent IPSOS MORI Presentation of Gender gap Data
However the actual IPSOS MORI presentation of the gender gap data involves use of both the Female-Male Gender Gap and the Male-Female Gap . In each of the IPSOS MORI studies of the General Elections of 1997, 2001, 2005 and 2010 the gender gaps are calculated. In the following table it is clear that for the General Elections of 1974[OCT] to 2001 IPSOS MORI define the Gender Gap as the Female-Male gender gap and measure it as [Female Conservative vote- Female Labour Vote ] minus [Male Conservative Vote- Male Labour Vote] and the positive but declining figures indicate that females were relatively Pro-Conservative /anti Labour by comparison with men between 1974 [Oct ] and 2001.
. On Page 298 of Explaining Cameron's Coalition Robert Worcester., Robert Mortimore and others [for IPSOS MORI} present the data on the Gender Gap slightly differently using the following table to indicate that between October 1974 and 2001 women were relatively pro-Conservative and anti- Labour [although to a declining extent] but that in 2005 and 2010 males were relatively pro-Conservative and anti-Labour. You could say that they are using the Female-Male Gender gap between 1974 [Oct] and 2001 and the Male-Female Gender gap in 2005 and 2010 . Nevertheless this does seem to be a particularly clear presentation of trends in "the gender gap" which would be very useful or examination purposes among other things.
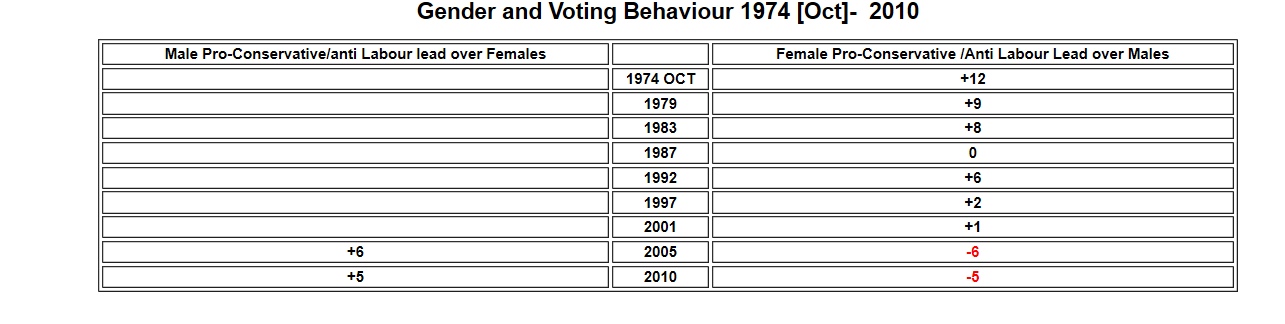
If we continue to measure the Gender Gap as the Female-Male gender gap the gaps for 2005 and 2006 would be minus6 and minus 5 respectively indicating that in 2005 and 2010 women were relatively less Conservative/pro-Labour in comparison with men. I have included these minus figures in red .
However these red data do not appear in the original IPSOS MORI Table [See Explaining Cameron's Coalition p286] because in their own table IPSOS MORI actually switch from measurement of the Female-Male Gender gap to the measurement of the Male-Female Gender gap which has become positive in 2005 and 2010 indicating that men are now relatively pro-Conservative /anti Labour in comparison with women. [What are the M-F Gender gaps between 1974 Oct and 2001? I am sure you know!]
Thus the IPSOS MORI data show that a positive Female-Male gender gap from 1974 Oct to 2001 [excluding 1987] has been transformed into a Positive Male-Female gender gap in 2005 and 2010. Female relative pro-Conservatism/anti-Labourism has been replaced by Male relative pro-Conservatism/ anti-Labourism. This does seem to be a particularly clear way of illustrating changes in relative Female and Male voting behaviour since October 1974.
Relative female Pro-Conservative/Anti-Labour voting up to 2005 was usually explained by theories that for much of the C20th, women were less likely to be in paid employment and less likely to be trade union members or because women were seen as possibly more "traditional" or more "deferential" than men in their views as a result gender differences in socialisation or because women, on average, live longer than men and age is correlated with Conservative voting.
However according to the IPSOS MORI data females were relatively Anti-Conservative and Pro-Labour in 2005 and 2010. This may have been due to long run generational changes in female attitudes and values and/or to the return to Parliament of an increasing number of female, Labour MPs and/or to Labour's greater willingness to campaign on female related issues although many women may have been dissuaded from voting Labour in 2005 as a result of UK involvement in the Iraq war .
Further insights into the relationships between gender and voting behaviour may be found via the consideration of relationships between gender, age and voting behaviour
Gender, Age and Voting Behaviour Between 1974 Oct and 2001
IPSOS MORI found that the Female-Male Gender gap between 1974 Oct and 2001 was general positive for all voters illustrating that in overall terms women at this time were relatively more pro-Conservative /anti -Labour than men. However when they calculated gender gaps for different age groups they found that even though the overall Female -Male gender gap was positive in 1983, 1992 and 1997 and zero in 1987 indicating women's overall relative pro-Conservatism/anti -Labourism negative Female-Male gender gaps sometimes occurred among younger voters indicating that young women were relatively anti Conservative/ pro-Labour in comparison with younger men. The following table provides information on the gender gap related to age.
Table3: Gender, Age and Voting Behaviour 1983-2010 ] [Data for 1983 -2001 from Explaining Labour's Second Landslide: R. Worcester and R. Mortimore for IPSOS MORI]
{Disregard the 2005 and 2010 data for the time being although I shall refer to them later in the document]
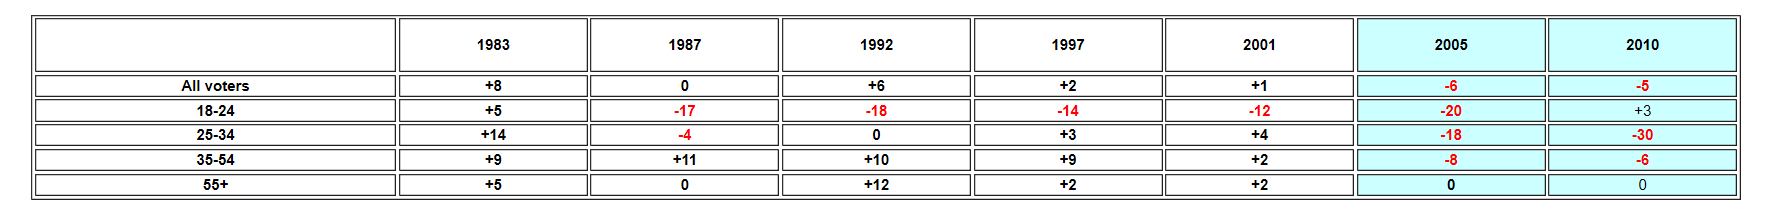
Thus although women in total tended to be more Pro Conservative/anti Labour in between 1983 and 2001 [as indicated by the positive Female-Male Gender gap for all voters] relative pro-Conservatism /anti-Labourism was usually greater among older women relative to older men than among younger women -relative to younger men as indicated especially by the large negative female -male gender gaps for 18-24 year olds in 1987-2001 and the narrow gender gaps [negative, zero and only narrowly positive among 25-34 year olds.
Gender, Age and Voting Behaviour in 2005 and 2010
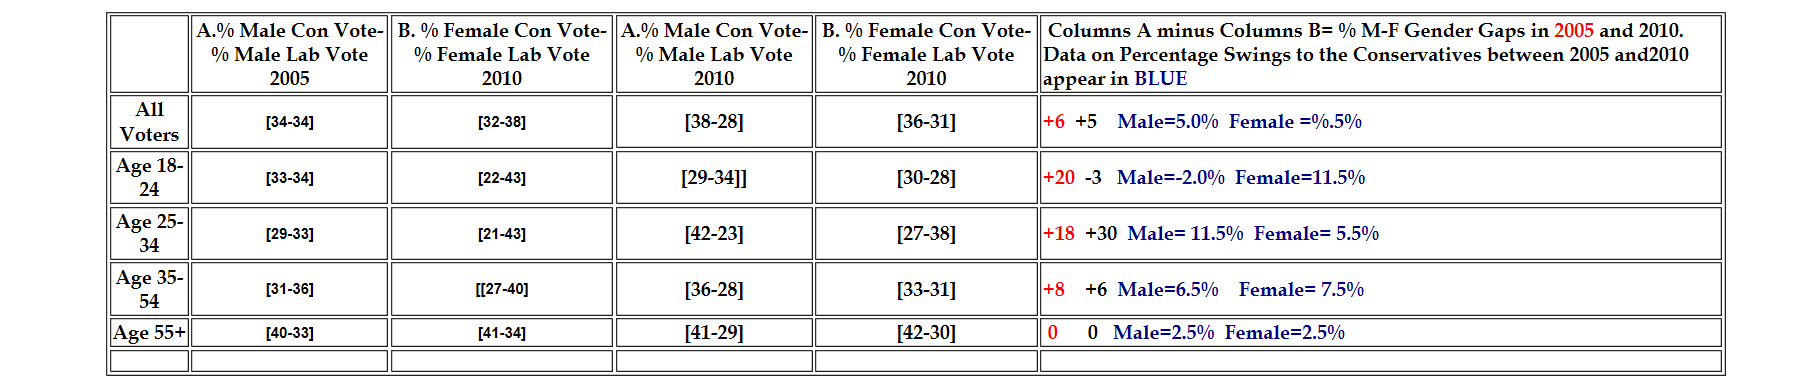
We have seen in Table 2 above that IPSOS MORI began in 2005 to present their summary information on the Gender Gap in terms of the Male- Female Gender Gap and the same procedure is adopted by Rosie Campbell in her recent writing on voting behaviour. I shall therefore use this same procedure below and the Male -Female Gender Gap in Conservative voting is measured as:
[% Male Con Vote- % Male Lab Vote ] minus [% Female Con Vote- % Female Lab Vote] and a positive Male-Female Gender gap in 2005 and 2010 implies that men have become relatively pro-Conservative/anti-Labour by comparison with women.
Using IPSOS MORI data I have calculated the overall Male-Female gender gap and various Male-Female gender gaps for different age groups in the 2005 and 2010 General Elections.
Click here and follow links for Ipsos Mori data on How Britain Voted in 2010 and in all General Elections since 1974
Table 4:Male-Female Gender Gaps and the 2005 and 2010 General Elections [based upon IPSOS MORI Data]
- By 2005 males as a whole had become relatively pro-Conservative/anti- Labour by comparison with females primarily as a result of the development of large positive Male-Female gender gap among 18-24 year olds and among 25-34 year olds.
- However by 2010 the situation among young women changed significantly.
- Among voters 18-24 young men swung slightly from Conservative to Labour between 2005 and 2010 whereas young women swung substantially toward the Conservatives to such an extent that males 18-24 were actually less pro-Conservative/anti-Labour than females 18-24 .in 2010.
- However among voters 25-34 males swung more toward the Conservatives than women 25-34 so that males were even more relatively pro--Conservative/anti-Labour relative to females in 2010 than they were in 2005.
- The large changes in different directions in the Gender gap among 18-24 year olds and 25-34 year olds more or less offset each other and this , combined with the much smaller changes among other age groups meant that there was very little change in the overall Male-Female gender gap between 2005 and 2010.combined .
|
Technicalities
|
Gender, Age, Social Class and Voting Behaviour in 2001 and 2010.
So far we have investigated the trends in the overall gender gap and the variations in the gender gap as between voters of differing age groups. In their study of the 2001 General Election Robert Worcester and Roger Mortimore presented information relationships between Gender, Age and Social Class. {See Explaining Labour's Second Landslide pp 201-2Robert Worcester and Roger Mortimore.] These data are presented in summary form as follows.

We may note the following main points
- Traditional Positive Female-Male Gender gaps existed among voters aged 55+ in both social classes
- Non -traditional negative gender gaps existed among voters aged 18-24 in both social classes. However the negative gender gap was far greater in the C2DE social class than in the ABC1 social class.
Some further information on gender, age and voting behaviour and gender. social class and voting behaviour in 2005 and 2010 is presented below..
Gender , Social Class and Voting behaviour in 2010
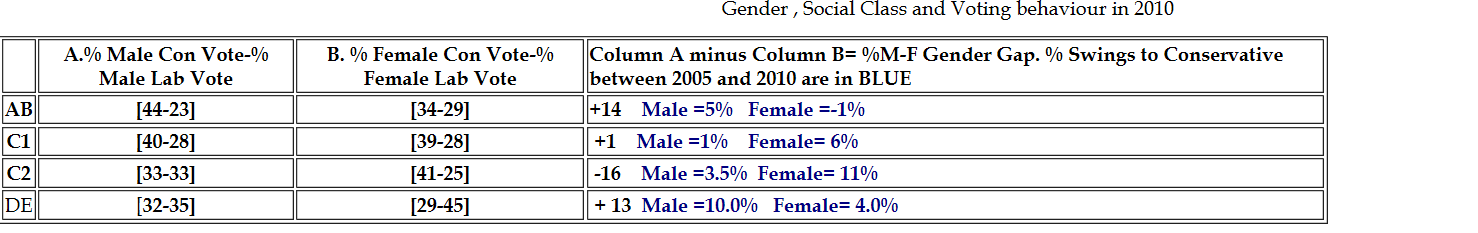
- AB Males are relatively Pro-Conservative and Anti-Labour compared with AB females. Notice that AB females actually swung from Conservative to Labour between 2005 and 2010. All other social class/gender groups swung to the Conservatives.
- The gender gap is negligible among C1 voters.
- C2 males are relatively anti-Conservative and pro-Labour compared with C2 Females. Notice that the C2 Male swing to Conservative was far smaller than the C2 Female swing to Conservative.
- However DE males are relatively pro-Conservative and anti-labour compared with DE females. Notice that the DE Male swing to Conservative was far greater than the DE Female swing to Conservative.
- How would you explain the significant differences in voting behaviour of C2 and DE women?
These IPSOS MORI data are extremely useful but it is important to note that there were some variations in findings of different polls at the time of the 2010 General Election. For example in some YouGov surveys at the time of the 2010 General Election the overall traditional gender gap does reappear and also Tim Bale and Paul Webb in Chapter Two of Britain at the Polls 2010 : Nicholas Allen and John Bartle {Editors] 2010 reaches the same conclusion . You may click here for a YouGov 2010 Survey for the Sun Newspaper [Fieldwork 2nd-3rd May] and click here for a YouGov 2010 Survey for the Sun Newspaper [Fieldwork 4th -5th May]: data from the latter survey suggest that the traditional gender gap in voting behaviour returned in 2010.
However you may also click here for a more recent Daily Telegraph article [January 30th 2012] which, among other things, contains polling data from YouGov for January 2012 which indicate that the Conservatives are indeed currently more popular with men than with women. Click here for a similar item from the Guardian
Click here for a report of research on women's political attitudes which may help to explain the reversal of the traditional gender gap in voting behaviour
You may also click here for BBC Analysis Programme [about 25 minutes] on Gender and Voting Behaviour.
Addendum: March 2012: Click here for the You Gov Survey based on fieldwork March 27-28 2012 for the the Sun Newspaper for recent data on gender and voting intention.
Students should discuss with their teachers how to respond to this divergence in research findings.
Addendum : June 2012 Click here and here for some video clips from the BBC
- Age and Voting Behaviour
It is argued traditionally that young voters are more likely than older voters to vote Labour and less likely than older voters to vote Conservative. The 2010 data do illustrate that , broadly speaking, the likelihood of voting Conservative increased with age: 30% of voters aged 18 24 voted Conservative compared with 44% of voters 65+.
In the 2010 the likelihood of voting Labour varied only slightly with age but, interestingly, young people were considerably more likely to vote Liberal Democrat than voters aged 55+. This may well have been related to the Liberal Democrats opposition at the time of the General Election to increases University tuition fees and certainly helps to explain many students' extreme dissatisfaction with the Liberal Democrats once they voted in favour of substantial increases in tuition fees.
Click here and follow links for Ipsos Mori data on How Britain Voted in 2010 and in all General Elections since 1974
- Ethnicity and the 2010 General Election
Sociology students will be familiar with the important distinction between "race" [which is a biologically based concept of negligible scientific validity] and the much more useful concept of ethnicity which refers to the cultural, religious and linguistic aspects of different social groups' lives. I focus here on relationships between ethnicity and voting behaviour.

As is shown above ethnic minority voters [both Asian and Black] were far more likely than White voters to vote Labour and far less likely to vote Conservative in the General election of 1997. This, of course, should come as no surprise since although ethnic minority members can be found throughout the British class structure Afro-Caribbean origin and Bangladeshi and Pakistani origin people are represented disproportionately in the working class, disproportionately likely to experience poverty and also disproportionately likely to live in large conurbations where working class support for Labour is strongest. The discrepancy between Black and Asian voting can be explained at least to some extent by the more privileged situation of Indian voters relative to other ethnic minority voters.
Nevertheless in overall terms ethnic minority members in all social classes are more likely than white voters in the same social classes to vote Labour which suggests that ethnicity has an important independent effect on voting behaviour beyond what would be predicted solely by the consideration of the class situations of ethnic minority voters. Ethnic minority voters may tend to believe that even if significant patterns of ethnic disadvantage continue to exist in UK society, Labour governments have at least addressed these problems more meaningfully than have Conservative governments which, if anything are associated with the hardening of ethnic inequalities especially in the era of Thatcherism. Furthermore although ethnic minorities are heavily underrepresented among MPs in all political parties it has traditionally seemed more likely that their representation would increase faster in the Labour Party and in in the 2005 General Election twelve Labour MPs , two Conservative MPs and zero Liberal Democrat MPs were from BME backgrounds.
When he became leader of the Conservative Party David Cameron stated that he hoped to promote the election of more Conservative BME MPs and this may have encouraged greater electoral support among BME voters for the Conservatives. In the event in 2010 27 BME MPs were elected to Parliament: 16 Labour MPs , 11 Conservative MPs and zero Liberal Democrats. and so Mr Cameron can claim to have made some progress in this respect. Nevertheless members of BME groups are still under-represented in Parliament: at the time of the 2001 Census BME members constituted 7.9% of the UK population but only 4.2% of MPs after the 2010 General Election.
It has been argued that gradual changes in the UK class structure resulting in the increased representation of ethnic minority members within the UK middle class could be expected to lead to increased support for the Conservative party especially perhaps among Indian -origin and some -origin voters.
Click here for Lord Ashcroft's Publication [April 2012] on Ethnicity and Voting Behaviour. Lord Ashcroft is a former Deputy Chairman of the Conservative Party who has been involved heavily in the finance and organisation of previous Conservative Party election campaigns. The publication provides very detailed information on ethnic patterns of voting behaviour with the aim of devising new strategies for increasing the attractiveness of the Conservative Party to ethnic minority voters.
Region and Voting Behaviour
Voters in Scotland, Wales and the more northerly regions of Great Britain have traditionally more likely to vote Labour than Conservative partly because there have traditionally been larger percentages of working class voters in these areas and because in areas of high working class concentration the likelihood that working class voters will in fact vote Labour tends to be greater. It has been noted elsewhere that the linkages between social class and voting behaviour have tended to weaken especially since the 1960s but it has also been argued that there are good reasons to believe that this process of class dealignment may be stronger in the South of England than in Northern England, Scotland and Wales.
Percentage Vote Shares of Conservatives, Labour, Liberal Democrats, SNP and PC 1997-2010
The following data illustrate regional differences in voting behaviour between 1997 and 2010. They have been collated from successive House of Commons Library Research Papers on the General Elections of 1997, 2001, 2005 and 2010. {Notice that I have included the SNP and PC votes as percentages of the Scottish and Welsh votes respectively but have not included the SNP and PC votes as percentages of the GB and UK votes; neither have I included data on votes for other UK parties nor on the vote shares of the Northern Irish parties. Interested students may consult the original sources for these data. ]
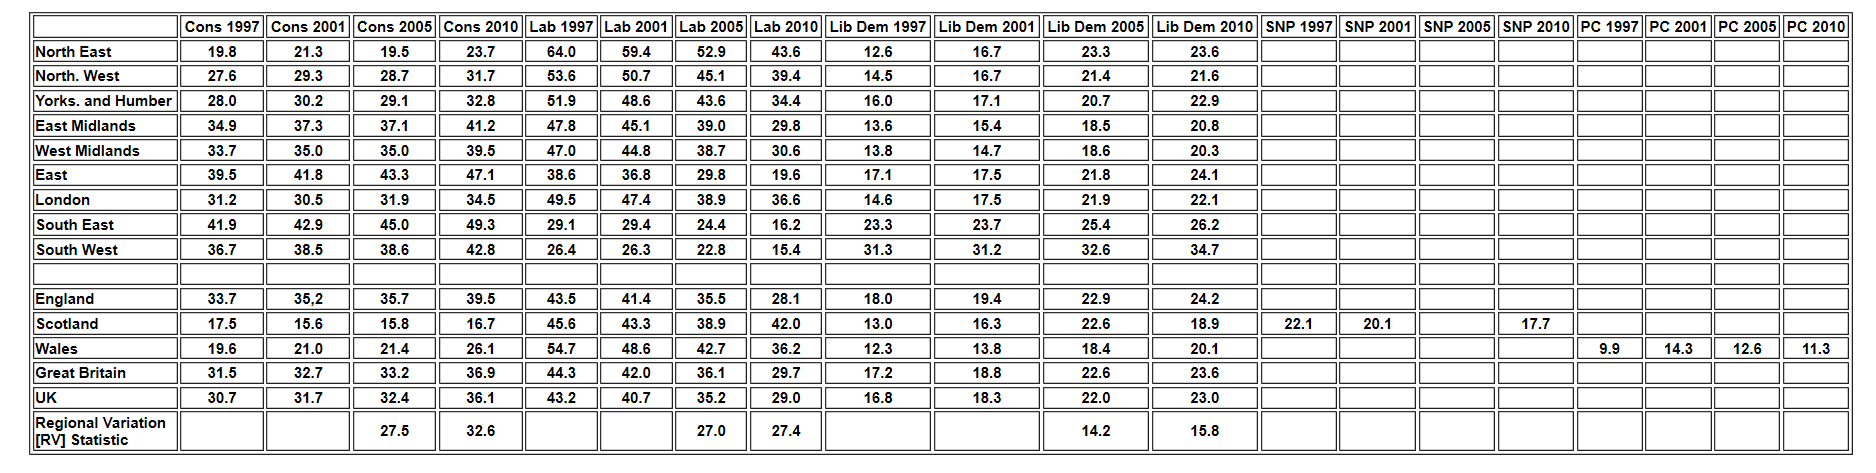
With regard to the General Elections of 1997, 2001 , 2005 and 2010 if we compare the General Election results of 1997 and 2010 we may note the following main regional trends
- Notice that in each of the 4 General Elections English voters have been more pro-Conservative and less pro-Labour than Scottish and Welsh voters.
- However note that in both 1997 and 2001 English voters were nevertheless more likely to vote Labour than to vote Conservative. In 2005 and 2010 the reverse was the case.
- Labour's large 1997 leads over the Conservatives in the North East, the North West and Yorkshire and Humberside diminished substantially by 2010.
- The East Midlands and the West Midlands were pro-Labour in 1997 but pro-Conservative in 2010.
- London was strongly pro-Labour in 1997 but only narrowly pro-Labour in 2010.
- The Conservatives' 1997 lead over Labour in the East ,the South East and the South West increased considerably by 2010.
- Between 1997 and 2010 there was little overall change in Labour's lead over the Conservatives in Scotland.
- Support for Labour actually increased between 2005 and 2010: the only Country/region where this occurred. Reasons included Gordon Brown's Scottishness, the fact that the Liberal Democrats had discarded two Scottish leaders and the possibility that the SNP rather than the Labour Government received more blame for economic difficulties in Scotland. Notice also that David Cameron's strategy seemed to fall on many deaf ears in Scotland.
- Support for Labour in Wales declined very considerably between 1997 and 2010 and the Conservatives and Liberal Democrats gained approximately equally as a result of the decline in Labour's support .
- Liberal Democrat support in creased between 1997 in all of the English Regions and in Scotland and Wales . However interestingly, the increase in Liberal Democrat support was smallest in the South West which has traditionally been the area most strongly in support of the Liberal Democrats leading to speculation that Liberal Democrat support may have peaked , at least temporarily in the South West.
- The final row of the second table provides a measure of regional variation [RV] in voting behaviour in the general elections of 2005 and 2010. For each main political party the RV statistic shows the percentage difference in voter support between the most popular region and the least popular countries/regions. You may notice for example that the regional variation in support for the Lib Dems is lower than for the Conservative and Labour parties and that the RV increased for the Conservative Party increased by more than the RVs for Labour and Liberal Democrats.
Social Influences on Turnout
Click here and follow links for Ipsos Mori data on How Britain Voted in 2010 and in all General Elections since 1974
This document also provides detailed estimates of the social influences on turnout in Great Britain and of the changes in the social distribution of the turnout since 2005.]
Click here for information from the BBC on regional differences in turnout
The main trends were as follows:
- Overall GB turnout was estimated as 65%.
- Male turnout [66%] was slightly higher than female turnout [64%].
- There were significant age differences in turnout ranging from 37% for 18-24 year olds to 75% for those aged 65+.
- There were significant gender differences in turnout among voters aged 18-24 but not among other age groups. Turnout among males 18-24 was 50% but only 39% among females aged 18-24.
- There were significant Social Class differences in turnout ranging from 76% among AB voters to 57 % among DE voters .
- Voter turnout varied significantly according to housing tenure: turnout among home owners was 74%, among mortgage holders 66%, among social renters 55% and among private renters 55%.
- I hope to include some information on ethnicity and turnout fairly soon.
Manchester Central [44.31%], Leeds Central [46.01%] and Birmingham Ladywood [48.66%] had the lowest turnouts and Renfrewshire East [77.26%], Westmoreland and Lonsdale [76.86%] and Richmond Park [76.23%] had the highest turnouts.
The Mass Media and the General Election
I hope to provide some further information on the Mass Media and the 2010 General Election fairly soon which Meanwhile the following paragraphs recycle some general information on the Mass Media and voting behaviour from an earlier document and you may also find the subsequent links useful.
The dominant ideology model of voting behaviour may reasonably be seen as one significant element of the more general theory which suggests that the existence of a dominant ideology has a major influence on politically attitudes more generally. Although supporters of the dominant ideology model would not necessarily describe themselves as Marxists it is perhaps fair to say that the principal inspiration for the model is the Marxist notion that " in every epoch the ruling ideas are the ideas of the ruling class" [The German Ideology 1846.]
Thus it is argued that capitalist societies are dominated by a ruling class which is able to maintain its position of economic and political dominance by means of a socialisation process operating via institutions such as the Family, the Church, the Education system, the Political Parties and the Mass Media which persuades members of disadvantaged , subservient social classes to accept that ruling class control is actually also in the best interests of the subservient classes: that is the socialisation process under capitalism results in the transmission of a dominant class ideology which creates false class consciousness among disadvantaged social classes preventing their members from recognising that the capitalist system is the fundamental cause of their disadvantaged situation.
In the dominant ideology model of voting behaviour it is argued that the mass media [and in particular the press] have traditionally been supportive of Conservative political opinion and that mass media influence has persuaded large swathes of working class voters to vote Conservative when in reality it has not been in their interests to do so. Furthermore if and when national newspapers have supported the Labour Party [as in the Blair era] this has been precisely because under the leadership of Tony Blair Labour offered no challenge to the interests of the capitalist class while more recently the election of Mr. Ed Miliband as Labour Party leader has been presented in some sections of the press as evidence of a dangerous "lurch to the Left" under "RED ED" [ the son of the late Ralph Miliband , a famous Marxist intellectual] whose election was made possible only by the disproportionate influence of trade union leaders. [Perhaps there is material here for David Mitchell's True or False Game Show! ]
Critics of the dominant ideology model of voting behaviour may argue that Marxist -inspired analyses of the capitalist system are flawed in that it is actually existing modern capitalism that is most likely to guarantee individual liberties and to generate rising living standards for all; that the mass media are far less biased than is implied in the dominant ideology model and that the activities of the mass media can be explained more accurately in terms of pluralist theories ; that the dominant ideology model overstates the persuasive capacities of the mass media and understates the capacities of voters to make up their own minds; and that insofar as there are correlations between newspaper readership and voting behaviour this occurs because voters choose to read newspapers reflecting their own political opinions not because the newspapers have been able to determine voters' political opinions.
Supporters of the dominant ideology model of voting behaviour argue that even after all of these criticisms are fairly assessed the model does nevertheless make a significant contribution to the overall explanation of voting behaviour.
[Further assessment of the dominant ideology model would require a full discussion of the strengths and weaknesses of Marxist theories, of the organisation, activities and effects of the mass media in general and of studies of the actual influences of the mass media on voting behaviour in particular. Doubtless you will be discussing these issues with your teachers!]
- Click here for a Guardian Item on the Press and the General Election
- Click here for a Guardian Item on TV and The General Election
- A detailed analysis of relationships between newspaper readership and voting behaviour n 2010 can be found here. IPSOS MORI: The Mass Media and Voting Behaviour 1992-2010
- Click here for a summary article on the press and voting intention from the LSE Politics and Policy Blog.This article also contains a link to more detailed materials from Democratic Audit.
For Section 4: The General Election of 2010: Data - Click Here