Introduction: Social Democracy, New Labour and Ideology
Click here for transcript of Jeremy Paxman’s interview with Tony Blair in which he provides a defence of economic inequality
The Labour Party has been described as a” broad church” whose members’ ideological positions vary from the radically socialist to the moderately social democratic although the party has usually been controlled by relatively moderate social democratic leaders whose moderate policies were usually supported by the block votes of moderate trade union leaders at Labour Party Annual Conferences. Thus Labour governments from 1945-51 did introduce what were seen at the time as significant economic and social reforms involving the nationalisation of several basic industries, the expansion of the Welfare State, the use of Keynesian methods of demand management designed to secure full employment, economic stability and growth as well as the increased use of tripartite decision- making procedures all of which were intended to promote rising average living standards and increased equality of outcome and of opportunity.
However post-war Labour governments also supported the continued existence of a mixed economy which in practice would be dominated by the private sector and believed that any equalisation of incomes should be fairly gradual so as not to undermine the financial incentives upon which economic growth was assumed to depend nor to alienate the electoral support of more affluent voters. Nevertheless as the Conservatives also accepted much of this so-called post-war consensus there were notable increases in income equality from the late 1940s to the mid 1970s although even by the mid 1970s income inequalities were still considerable and researchers such as Brian Abel-Smith and Peter Townsend argued that relative poverty had actually increased during the 1950s and 1960s.
As has been indicated in a previous document these post-war equalising trends were decisively reversed under Conservative governments of 1979-97 [although income inequalities were reduced slightly between 1990 and 1997] but it was hoped [although not necessarily expected] by many that the election in 1997 of a Labour government with a very large parliamentary majority would result in a significant reversal of Conservative policies and lead to the revival of trends toward greater income equality. However Labour’s ideological positions underwent significant modifications under the leadership of Tony Blair which meant that the prospects for increased income equality proved to be rather weaker than might have been expected. To see why some further information on these ideological changes is required.
Labour and Ideology 1983- 2010
After winning General Elections in 1964, 1966, and 1974 [twice] Labour suffered defeat in 4 consecutive General Elections [1979, 1983, 1987 and 1992]. The General Election defeat of 1983 had been especially disastrous and when Neil Kinnock took over from Michael Foot as leader of the Labour Party he set about the modernisation of the Labour Party’s apparently dated image and the gradual replacement of the radical left-wing policies which in the opinion of many were responsible for the great defeat of 1983 with more moderate but still recognisably social democratic policies. However try as he might Kinnock was unable to prevent further General Election defeats in 1987 and 1992 and he resigned to be replaced briefly by John Smith who died tragically of a heart attack in 1994. He in turn was replaced as leader by Tony Blair .
According to Blair and his supporters [one of whom was initially Gordon Brown who stepped aside to give Tony Blair a greater chance of winning the Labour Party leadership election] the disastrous defeat of 1983 established beyond doubt the case for modernisation and despite the best efforts of previous leaders Neil Kinnock and John Smith further modernisation was now essential if Labour were ever to regain power again. Blair and his supporters believed that there were both sociological and political reasons for the four consecutive General Election defeats. Such reasons included the following.
- Labour traditionally received relatively more electoral support from the working class but the relative size of the working class was declining and it was believed also that as working class people became more affluent they identified less with core Labour policies such as relatively high taxation and high expenditure on the welfare state [the so-called tax and spend approach to economic and social policy], support for further nationalisation and close links with the trade unions.
- It was therefore necessary for Labour to devise policies which would appeal to a coalition of middle class and more aspirational working class voters who opposed relatively high taxation and looked instead for greater individual freedom for themselves and their children to better themselves by their own efforts.
- It was claimed that orthodox social democracy had been undermined because the “fall of communism” was considered to have occurred because of the inefficiencies of centrally planned communist economies and it was suggested that that the social democratic emphasis on high government spending on nationalisation and an over-bureaucratic welfare state was also misguided. In this respect it was argued that Thatcherite New Right ideas were actually more economically credible than the ideology of orthodox social democracy in that economic prosperity depended crucially upon the dynamism or otherwise of the capitalist sector of the economy which according to Blair especially meant that significant income inequalities were desirable and essential since they provided the financial incentives necessary to secure economic efficiency.
- Finally the growth of globalisation meant that it would be more difficult for nation states to organise their economies on a social democratic basis. Social democratic governments might wish in principle to levy high rates of income taxation on the rich and high rates of corporation tax on business profits and to redistribute income to the poor but if they did so talented individuals would leave the country and foreign investment into the UK would be reduced resulting in reduced economic efficiency and increased unemployment. Therefore efforts to increase economic equality would actually result in reduced living standards for the poor. There were limits also in the extent to which Keynesian policies could be used to reduce unemployment because such policies were potentially inflationary and would lead rapidly to increased unemployment caused by reduced international competitiveness.
Tony Blair was elected leader of the Labour party in July 1994; at the October 1994 Labour party conference the term “New Labour” was unveiled for the first time in the slogan” New Labour: New Britain” and at a special Labour party conference in April 1995 the apparent fundamental break with past Labour party history was symbolised when the Labour Party accepted Blair’s redrafted Labour party constitution which removed its commitment to the nationalisation of the means of production. Given the four consecutive general election defeats suffered by the Labour party in 1979, 1983, 1987 and 1992 it is easy to see why Tony Blair and his modernising supporters wished to re-brand the Labour Party as “New Labour” in order to signal its break with the failed policies if “Old Labour”. However the meanings of the terms “Old Labour” and “New Labour” must be analysed with care.
The Blairites did not wish to distance themselves from the achievements of the 1945-51 Labour governments but from the perceived relative failures of the Wilson and Callaghan governments of the 1960s and 1970s and in particular from the more radical left wing policies of the Labour Party between 1979 and 1983. Thus while in the eyes of the Blairites the Wilson-Callaghan governments had accepted the continued existence of nationalised industries, had retained close relationships with the trade unions and had failed to reform the institutions of the welfare state and Labour in 1979-83 had also supported increased state control of the economy, increased public ownership, withdrawal from the EEC and unilateral nuclear disarmament, Blair’s New Labour party would accept none of these things.
Instead it would accept the privatisations, trade union reforms and low income taxation policies introduced by Mrs Thatcher but it would also extend and modernise the welfare state and amend the UK constitution via the introduction of a range of liberal reforms such as devolution, House of Lords reform, a Human Rights Act and a Freedom of Information Act. It would be fair to say, therefore, that under Tony Blair New Labour did represent a break with Labour’s past and in this sense Blair could be described as a neo-revisionist of Labour’s ideology. However we should also note important continuities between Blair’s ideology and the ideology of traditional social democracy and moderate social democrats have always played an important role within the Labour party such that, for example, the revisionist Labour party theorist Tony Crosland had called for the restriction of further nationalisation in his 1956 study entitled “The Future of Socialism” and the then Labour Party leader Hugh Gaitskell had tried [but unsuccessfully ] to remove the commitment to nationalisation from the Labour party constitution in 1959.
We might conclude therefore that although Blair’s re-branding of the Labour party did result in fundamental shift of ideology and policy there are also continuities with the complex past history of the Labour party .Some elements of New Labour thinking have always been present to some extent within Labour party ideology and in response to criticisms that they had accepted far too much of the ideology of the New Right the Blairites would claim that their values remained thoroughly social democratic but that it was nevertheless necessary to modernise Labour policies if social democratic objectives were to be achieved in the modern age. Thus Anthony Giddens argued that New Labour policies amounted to a so-called Third Way which would move beyond both the “Old Labour” version of excessively statist social democracy and the market based neo-liberalism of the Thatcherite era to combine the economic efficiency of the market with social democratic values emphasising “fairness” and “community” rather than Thatcherite individualism .The ideology of New Labour is described in more detail in the Political Ideologies section of this website.
New Labour Ideology: Its Implications for Economic Inequality
The ideological repositioning of the “New Labour Party” could be expected to have important implications for likely trends in economic inequality.
- In the New Labour view intensification of the globalisation process meant that countries could safeguard and improve their average living standards only through the increased efficiency of the private sector. This meant that income inequalities should be retained [much as in New Right ideology] because they provided the financial incentives necessary to promote economic efficiency whereas, conversely, higher rates of income taxation would reduce incentives to work, save, invest and innovate and might even drive successful entrepreneurs abroad all of which would endanger living standards, including the living standards of the poorest. It was possible also that, as in theories associated with the Laffer Curve, higher rates of income tax might actually lead to reduced taxation revenue as high income earners either decided to work less or increasingly employed skilful accountants to reduced their tax liability. In the event the incomes of high income earners rose relatively quickly in the New Labour years and higher rates of income taxation on high incomes were never introduced by Labour Governments until the budget of 2010 when they were hailed some quarters as heralding in “the demise of New Labour”. We shall see.
- As Chancellor of the Exchequer Gordon Brown decided that the UK financial sector should be subject only to “light touch regulation” which would help to promote its growth relative to the possibly more tightly regulated financial sectors of some other European countries. The rapidly rising incomes of highly paid employees within the financial sector were a key factor in the growth of overall original income inequality but Gordon Brown believed that even though these high income earners were officially paying a top marginal rate of income tax of 40P in the £ the taxation revenues so generated would help him to finance the significant expansion of the NHS and education system from which all could benefit. However despite some attempts to close taxation loopholes it has been claimed also that various techniques of tax avoidance [legal] and tax evasion [illegal] are costing the Exchequer anything between £ 40 billion [according to HMRC ]and £ 100 Billion per year [according to Richard Murphy] and the general conclusion must be that it was the unwillingness to restrict the growth incomes of high income earners which was the major factor which generated increased income inequality under New Labour governments. [Click here for Guardian article by Richard Murphy suggesting UK tax evasion of £70 Billion per year.]
- New Labour’s overall approach to social policy was based upon the principle that if poverty was to be reduced it was especially important to create more job opportunities and to encourage otherwise unemployed workers to take them. Thus the belief was , in the phrase much used in Bill Clinton’s Democratic Party, that ” people need a hand up rather than a hand out” and Labour’s New Deal policies were designed with this objective in mind. At the same time some new social benefits were introduced; New Labour also introduced a minimum wage , albeit at a relatively low level and it committed itself to the long term reduction of child poverty; all of which could be expected to reduce the growth of income inequality.
- Asked in 1997 what his three priorities for a future Labour Government would be Tony Blair famously replied “Education: Education: Education” and while he has defended continuing economic inequality as contributing to increased economic efficiency and rising living standards for all he has also argued strongly in support of equality of opportunity on grounds of fairness and increased economic efficiency . Some of Labour’s education policies such as the Sure Start programme might be expected to make some contribution to greater equality of opportunity [and even to greater equality] in the longer term but leftist critics will argue that equality of opportunity is impossible in an unequal society so that the relative failure of New Labour to reduce economic inequality will compromise its attempts to increase equality of opportunity.
Analysing Income Distribution Trends: Some Technicalities
In the remainder of this document I aim to describe the main trends in the distribution of income and in the extent of relative poverty under the Labour governments of 1997 -2010. As with my document on economic inequality and Conservative governments of 1979-1997 this document also is supplemented by a third “appendix” document in which I illustrate, at an introductory level, some of the technicalities involved in analysing trends in the distribution of income. Meanwhile as you study the information in this document you should remember bear in mind the following general points related to the presentation of data on the distribution of income .
- The presentation of data on the distribution of income relies on the concept of equivalised income whereby the data are presented for childless couples and equivalence scales are used to translate the incomes of different types of households .
- Statistical information is presented on the distribution of different kinds of income
- Original income is income received from employment, savings and investment before government intervention of any kind such as through payment of social security benefits and the imposition of taxation.
- Gross income = Original income + social security cash benefits.
- Disposable income= Gross income – direct taxes and National Insurance contributions.
- Post-tax income = Disposable income- indirect taxes.
- Final income = Post-tax income + benefits in kind such as health and education.
- These various definitions of income are used to illustrate the effects of taxes and benefits on the distribution of income. Original incomes are distributed much more unequally than final incomes mainly because social security cash benefits and state benefits in kind are received disproportionately by low income groups. Notice, however, that overall taxation has little impact on the distribution of final income because the equalising effects of mildly progressive direct taxation are offset by mildly regressive indirect taxation.
- The overall degree of income inequality can be measured vis the use of Lorenz curves and Gini Coefficients. A Gini Coefficient of Zero would represent maximum possible income equality and a Gini Coefficient of One would represent maximum possible income inequality. In recent years Gini Coefficients for Great Britain have ranged between 0.33- 0.4. Click here for further information on Lorenz Curves and Gini Coefficients .
- Information presented in An Anatomy of Economic Inequality [ especially pages 36-40] show that income growth has been faster for higher income recipients than for low income recipients.
- However information of the incomes of the top 1% and top 0.1% of income recipients indicates that their incomes have tended to increase even more rapidly than those of the top 10% and 20% of income recipients . Information on the incomes of high income recipients can be found if you Click here for IFS study entitled “Racing Away? The Evolution of High Incomes
- The Department of Work and Pensions [DWP] focuses on the distribution of household disposable income both before and after housing costs. The Institute of Fiscal Studies focuses on the distribution of disposable income before housing costs in its measures of income inequality. This means that the data of its reports are slightly different from those presented on the Poverty.Org site which provides income distribution data based upon the DWP information on the distribution of disposable income after housing costs. {Notice that since both the DWP and IFS data focus upon household disposable income the effects of indirect taxation and of benefits in kind are not considered in these sources.
Trends in the Distribution of UK Income 1997-2008/09
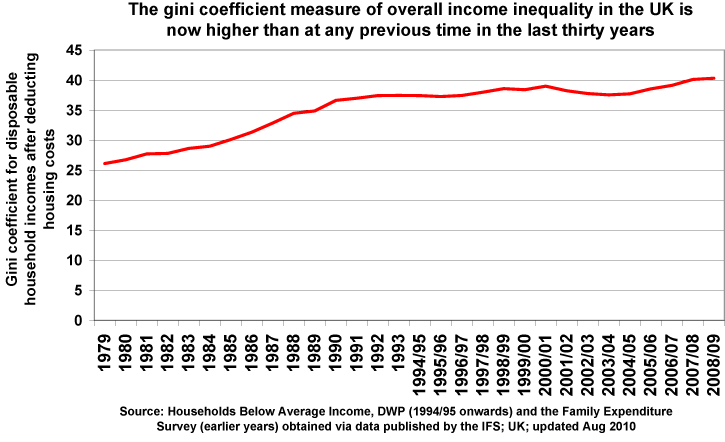
The following diagram from the Poverty.Org website illustrates clearly the trends in income inequality measured in relation to household disposable income after housing costs. between 1979 and 2007/08.[ As is shown, for example in DWP publications income inequality measured after housing costs is slightly greater than income inequality measured before housing costs. For more recent trends in the distribution of income from 2010 to 2021 click here and then on the link to income inequality [New link added April 2022]
Income Distribution Trends Under Labour Governments 1997-2010: Further Investigation.
It was unrealistic to expect that Labour governments led by Tony Blair would introduce radical egalitarian measures but many hoped nevertheless that some attempts would be made to reverse the increased economic inequalities of 1979-1997. In the event as indicated in the above data income inequality as measured by the Gini Coefficient changed only slightly under Labour Governments but the increases in income inequality form 2005/6 to 2007/08 meant that income inequality was in fact slightly greater than when Labour came to power in 1997, an outcome which certainly contradicted the traditional social democratic commitment to gradually increasing economic equality although New Labour’s commitments to greater economic equality had always been noticeably weaker.
Conservative and Liberal Democrat politicians during the General Election of 2010 made much of this growth of income inequality arguing that the data indicated that Labour governments had failed to improve the relative incomes of the most disadvantaged groups and that if elected they rather than Labour would do more to help the poor in the future and their arguments may have been given further resonance as a result of the furore surrounding Labour’s abolition of the 10P income tax rate which clearly disadvantaged low income groups and which Labour was soon forced to attempt to offset via other changes to the taxation and social security benefit system.
Perhaps it may be argued that most politicians’ statements during General Election campaigns should be interpreted with care and this advice may well apply to the Conservatives emphasis during the 2010 campaign on the growth of income inequality with a political poster of the smiling Gordon Brown along with the slogan “I increased the gap between Rich and Poor . Vote for me.” However it would have been more accurate to state that original income inequality increased significantly between 1997 and 2007/08 and that Labour’s policies did to some extent offset this growth of income inequality but not enough the halt the growth of inequality of disposable household incomes. From a social democratic perspective Labour’s record on income inequality was certainly not especially good but it was far better than the record of previous Conservative Governments and considerably better than implied by opposition politicians in the General Election campaign of 2010. [Conservatives of course would argue that the growth of income inequality especially between 1979 and 1990 was essential to re-establish the financial incentives necessary to regenerate the ailing British economy.]
Let us investigate in more detail the Income Distribution Trends under Labour Governments 1997-2008/09. [More recent data are as yet unavailable.]
- In contemporary conditions the operation of capitalist economies generates greater original income inequality over time primarily because the demand for highly qualified workers is increasing relative to its supply whereas this is clearly not the case . Therefore if Labour governments did nothing to offset the natural operation of the capitalist economy significant increases in income inequality could be expected.
- However Tony Blair and his supporters believed that income inequality was necessary and beneficial in that it created the financial incentives necessary to promote the faster economic growth which would generate rising living standards for all including the poorest . Consequently New Labour governments saw no need to raise rates of taxation on high income earners in general and while in particular Gordon Brown decided that the UK financial services sector should be subject only to “light touch regulation” in the hope that this would improve its competitive position relative to the financial services sectors of other advanced economies. The relatively fast growth of already high incomes generally and within the financial services sector was a key causal factor in the growth of income inequality but Gordon Brown believed that the taxation revenues so generated from these high income earners would help him to finance significant expansion of the NHS and the education system from which all UK citizens could benefit.
- The rapid growth of already high original incomes combined with the government’s unwillingness to raise rates of taxation on these high incomes would obviously, other things being equal, generate greater income inequality. In this respect Labour Governments feared that the higher taxation of high incomes would drive talented business men abroad which would actually undermine the competitiveness of the UK economy with disadvantageous effects even for the poorest.
- Nevertheless Labour governments did preside over a long period of steady economic growth and low unemployment and they did also introduce a minimum wage [albeit at a relatively low level] and a range of social security benefits designed to reduce relative poverty. They also committed themselves to the long term abolition of child poverty and did at least make some progress in this respect. These measures ,other things being equal, would generate greater income equality but it seemed highly likely that they would be insufficient to offset the increases in income inequality caused by the rapid growth of high incomes .
- The distribution of original incomes as measured by the Gini Coefficient did become significantly more unequal under Labour Governments between 1997 and 2008/9 dates
- Labour Government taxation and social security changes did moderate the growth of income inequality but did not completely offset it which meant that disposable income inequality did rise under Labour Governments but by not as much as original income inequality. Click here for IFS press Release: Labour’s tax and benefit increases prevent rapid rise in income inequality
- Post tax income inequality increased under Labour because although there was some income redistribution of income from comfortably off income recipients to moderately poor income recipients the post tax incomes of high income earners rose significantly more than the incomes of low income recipients. Click here for BBC coverage of IFS research on Income Inequality Trends under Labour Governments 1997-2008/09. Note that the final diagram in the BBC coverage is especially important.
- Students who require a full description and explanation of trends in income distribution under successive Labour Governments may access the relevant original IFS documents. Click here for IFS Report on Poverty and Inequality in the UK : 2010 and scroll down to pages 21-26 for income distribution trends or click here for Living Standards, Inequality and Labour’s Record IFS General Election Briefing 2010 and scroll down to Page 10 for income distribution trends. Some careful study of these sources will be very worthwhile.
- You may click here for a recent comparison of levels of income inequality in different countries using their Gini Coefficients.
Conclusions: Income Distribution Trends under Conservative and Labour Governments: Some Basic Comparisons
The IFS calculations of Gini Coefficients for the years 1979-2008/09 illustrate the following overall trends in income inequality.
- Income inequality rose rapidly during the Conservative administrations of Margaret Thatcher 1979-1990 partly because original income inequality increased substantially and because changes to taxation and social security benefits meant that final income inequality increased even more.
- However income inequality declined slightly under the Conservative administrations of John Major 1990-1997. It has been suggested that this decline in income inequality arose partly because of the generally slow rate of economic growth between 1990 and 1997 which resulted in a significantly reduced rate of growth of high incomes. There is information on Income Inequality Trends 1990-2003 in this IFS publication
- Post -tax Income inequality changed little during the first Labour administration of Tony Blair 1997-2001
- Post-tax Income inequality declined during Blair’s second administration of 2001-2005.
- Post-tax Income inequality then increased during the Blair/Brown administration of 2005 – 2008/09 such that post-tax income inequality was slightly greater in 2008/09 than when Labour came to office.
- This was because although Labour’s taxation and social security benefit changes did help to offset the growth of original income inequality they were insufficient to reverse it . Essentially then Labour had redistributed income among middle income recipients but failed to restrict the growth of high incomes and failed to protect the growth of low incomes. Remember that by comparison that Conservative changes in taxation and social security policies especially under Mrs. Thatcher actually had the effects of increasing income inequality .
- Overall post-tax income inequality as measured by trends in the Gini Coefficient increased much more rapidly under Conservative than under Labour Governments.
- However the slight overall increase in post-tax income inequality under Labour means that post -tax income inequality during 1979 -2008/09 reached its highest level in 2008/09.
- Further Links
- Click here for IFS study entitled “Racing Away? The Evolution of High Incomes
- Click here for BBC coverage of OECD report that UK income inequality was falling between 2001 and 2005. which supports the IFS assessment
- Click here for relevant recent Guardian Article with additional further links
- Click here for recent Guardian article by Larry Elliot comparing Conservative and Labour records on poverty and inequality
- Click here for Richard Wilkinson on Broken Society: Thatcher’s legacy
- Click here for BBC coverage of introduction of 50P Income tax rate
- Click here for further BBC coverage of the 50P Income tax rate
- Click here for BBC on Social Security Benefits 2009
- Click here for BBC coverage of Labour’s 2010 Budget
- Click here for Guardian article by Richard Murphy suggesting UK tax evasion of £70 Billion per year.
Appendix : Trends in Relative Poverty 1979-2008/09
The following diagram from Poverty.Org provides excellent summary information on trends in relative poverty since 1979
For more recent trends in Poverty from 2010 to 2021 click here and then on the link Replace link with Low Income Indicators [New link added April 2022]
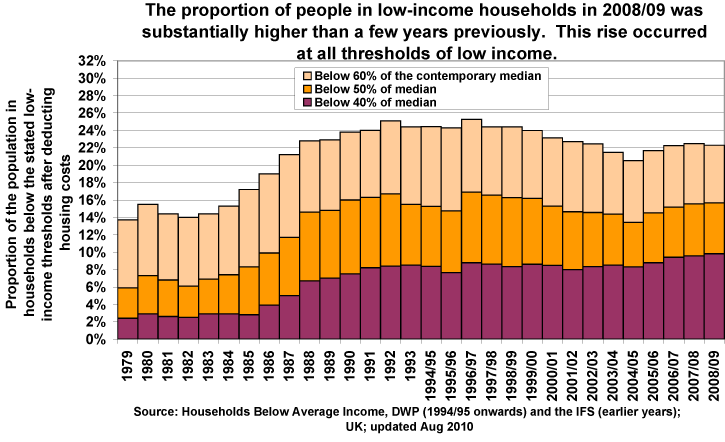
The most commonly used measure of relative poverty is “household income below 60% of contemporary median household income.”
- On this basis we see that the proportion of the population living in relative poverty rose significantly between 1979 and 1990 during the Conservative administrations of PM Thatcher and between 1990 and 1992 in the early years of the Premiership of John Major after which it did decline slightly until 1996/7 when it again increased.
- The proportion of the population living in relative poverty then fell under Labour Governments in every year between 1997/8 and 2004/05 after which it began to increase. The proportion of individuals living in households receiving less than 60% fell by about 3% between 1997/8 and 2007/08.
- However although the extent of relative poverty as defined above did fall between 1997/8 and 2007/08 the extent of what might be described as severe relative poverty measured as “household income below 40% of the median household income” fell very little between 1997/8 and 2001 after which it began to increase such that by 2007/08 it was greater than when Labour took office and, indeed was higher than at any other time during 1979 -2007/08.
- This suggests that even if the extent of relative poverty fell under Labour governments the extent of severe relative poverty actually increased which by any standards must be seen as a very disappointing outcome. However the measurement of severe poverty does present severe difficulties and a recent report from the IFS concludes that the above data , while very useful, do have some limitations which mean that we cannot be certain that severe poverty increased under Labour governments.
- Nevertheless the record of Labour Governments 1997-2008 suggests that so-called New Labour policies designed to alleviate severe poverty had only limited success and it is to be hoped that the current Coalition Government will be more successful in this respects although those on the Left will argue that this is highly unlikely and that only a general commitment to much greater equality together with the targeting of resources especially on the poor can significantly alleviate severe poverty.
- Click here for Polly Toynbee’s recent assessment of the future prospects for greater income equality.
What of the Future?
Spokespersons for the Coalition Government have stated that despite difficult economic circumstances they will do their utmost to safeguard the incomes of the poor but disputes have already arisen as the Institute of Fiscal Studies has argued that recent Coalition taxation and government spending changes have been regressive in their incidence while in turn government spokesperson claim that the IFS has “got it wrong”. And so the debate continues!
Appendix Two: Update to 2009/10
The following data relate to the distribution of household disposable income adjusted for household size before and after housing costs . Before looking at these data it may be useful to remind ourselves of the relationships between different kinds of Household Income.
- Original income is income received from employment, savings and investment before government intervention of any kind such as through payment of social security benefits and the imposition of taxation.
- Gross income = Original income + social security cash benefits.
- Disposable income= Gross income – direct taxes and National Insurance contributions.
- Post-tax income = Disposable income- indirect taxes.
- Final income = Post-tax income + benefits in kind such as health and education.
The most recent DWP publication Households below Average Income: An Analysis of the Income Distribution 1994/1995- 2009/10 was published on May 11th 2011. Click here for a link to the full report. Scroll down to Chapter Two for information on The Income Distribution 2009/10 where the diagrams on pages 20 and 21 and the tables on pages 30 and 31 of the report are especially useful. [However since the document contains an 18 page introduction you will actually need to scroll down to pages 38 and 39 and 48 and 49 of the document!].
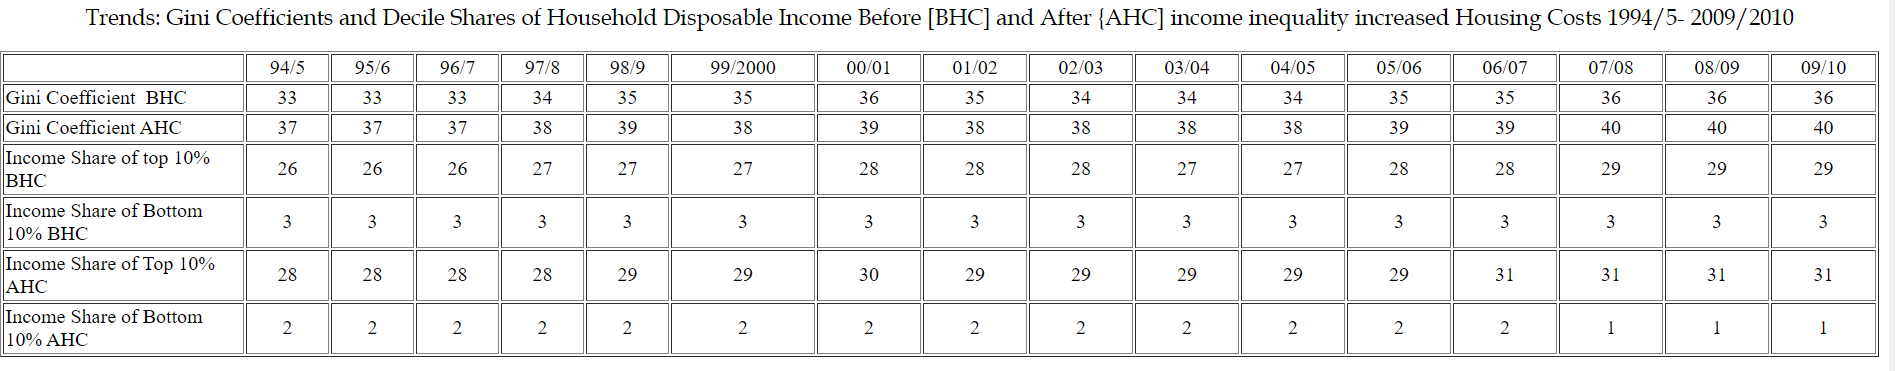
I have extracted summary data on Gini coefficient trends and some data on income decile shares from these tables but the original tables themselves do provide additional very significant information in trends in income decile and quintile shares of national income before and after housing costs and on various ratios between the income shares of different deciles and quintiles.
Trends: Gini Coefficients and Decile Shares of Household Disposable Income Before [BHC] and After {AHC] income inequality increased Housing Costs 1994/5- 2009/2010
Some Basic Conclusions
- In relation to the Gini Coefficient data we should note that both on a BHC and AHC basis income inequality increased in the era of Labour Governments but Labour would argue in its defence that its taxation and benefit policies taken in isolation did restrict the growth of income inequality although these policies were insufficient to offset entirely the growth of inequality of original incomes such that the distribution of disposable incomes did become more unequal.
- The authors of the Households Below Average Incomes Report do point out that estimates of the shares of household disposable incomes received by the top and bottom income deciles are subject to measurement and that, in particular the shares of household disposable income received by the bottom decile do not necessarily provide a good guide to their potential consumers expenditure because some members of the lowest decile may well have considerable savings to draw upon to finance consumption although some, of course, will not.
- However we may note that on the basis of these data in 2009/2010 the share of household disposable income [AHC] received by the highest decile was THIRTY times higher than the share received by the lowest decile. Before Housing Costs the share of the highest decile was TEN times higher than the share received by the lowest decile.
- Notice that these figures give a much starker picture of income inequality than the data comparing the incomes of the highest and lowest quintiles of income recipients as indicated here.
- Students are invited to imagine for themselves the shares of disposable household incomes received by the highest and lowest 1% of income recipients. For example an individual receiving an original income of £ 10Million per annum receives 1000 times more than an individual receiving an original income of £10,000 per annum and given the possibilities of tax avoidance the after- tax income differential would still be enormous.
- One of the key conclusions of the data on the distribution and redistribution of income is that taxation has little overall effect on the distribution of income because the effects of mildly progressive direct taxation [mainly income taxation] are offset by the regressive effects of Indirect taxation [mainly VAT].
Further Reading
-
- Click here for The Political Struggle Ahead by Doreen Massey. Brilliant!