The UK General Elections of 1997, 2001 and 2005: Some Comparisons
04/09/2017 : date last edited:
My Voting Behaviour documents have now been restructured, updated and revised. The original version of the first document has been divided into two sections with little further revision but the original document on the 1970s to the 1990s has been divided into two sections and revised quite significantly in an effort to clarify the differences between the various models of voting behaviour developed from the 1970s to the 1990s. The third document on the General Elections of 1997, 2001 and 2005 has been modified slightly and I have now also written a document on the 2010 General Election. which, as usual, includes links to the excellent IPSOS MORI coverage. Finally I have also recently added two pages of links on the 2015 and 2017 General Elections respectively. Thus the new structure is as follows:
Part A: The Analysis of Voting Behaviour in Great Britain: Electoral Stability, Party Identification and Social Class 1945-1970
Part B: Non-Class Influences on Voting Behaviour 1945-2010
Part A: Models of Voting Behaviour
Part B: The General Elections of 1992 and 1997
Document Three: The UK General Elections of 1997, 2001 and 2005: Some Comparisons
Document Five: A Page of Links on the UK General Election 2015
Click here for a page of links on the UK General Election 2017: Document Six
The original PowerPoint Presentations will not be altered but I have added a link to an excellent IPSOS MORI Slide Presentation on the 2010 General Election .
Click here for a PowerPoint on Document One
Click here for a PowerPoint on Models of Voting Behaviour
Click here for a PowerPoint on the Social Influences on Voting and Non-Voting
Click here for a PowerPoint on the General Elections of 1992, 1997, 2001 and 2005
Click here for the IPSOS MORI Presentation on the 2010 General Election
Some Further Links
Click here for BBC coverage of General Elections 1945-1997
Click here and follow links for Ipsos Mori data on How Britain Voted in all General Elections since October 1974 and for more detailed data on the 1997, 2001 and 2005 General Election . One of these links provides Ipsos Mori estimates of the relative importance of party images, party leaders and party policies as factors influencing the outcome of General Elections. See The Political Triangle.
Click here for the BBC's coverage of the 2005 General Election Results
- Click here for a Parliamentary Report on the UK General Election of 2005
- Click here for a BBC item on the importance of issues as determinants of voting behaviour
The UK General Elections of 1997, 2001 and 2005: Some Comparisons
This document is subdivided into the following sections:
1.Opinion Poll data on voting intentions between 1997 and 2005.
2.Comparing the basic General Election Results of 1997, 2001 and 2005
3 Further analysis of the General Election Results of 1997, 2001 and 2005
- Party Leadership
- Party Images
- Party Ideology: New Labour .A separate document will be added to the site later
- Party Identification
- Party Policies
- The Economy
- The Iraq War
- Social Class and Voting Behaviour : 1997, 2001 and 2005
- Turnout in 1997, 2001 and 2005
- Opinion Poll Data 1997-2005
Click here for an Opinion Poll Chart derived from quarterly data from the IPSOS MORI site .[ For 1997-2002 the data refer to all respondents giving a voting intention regardless of how certain they were to vote whereas from 2002 onwards the data refer to the voting intentions of those certain to vote. [In Sept 2000 at the high point of the fuel crisis some IPSOS MORI September polls put the Conservatives marginally ahead of the Labour Party. but the particular September Poll that I have used to construct my diagram has Labour Marginally ahead of the Conservatives.
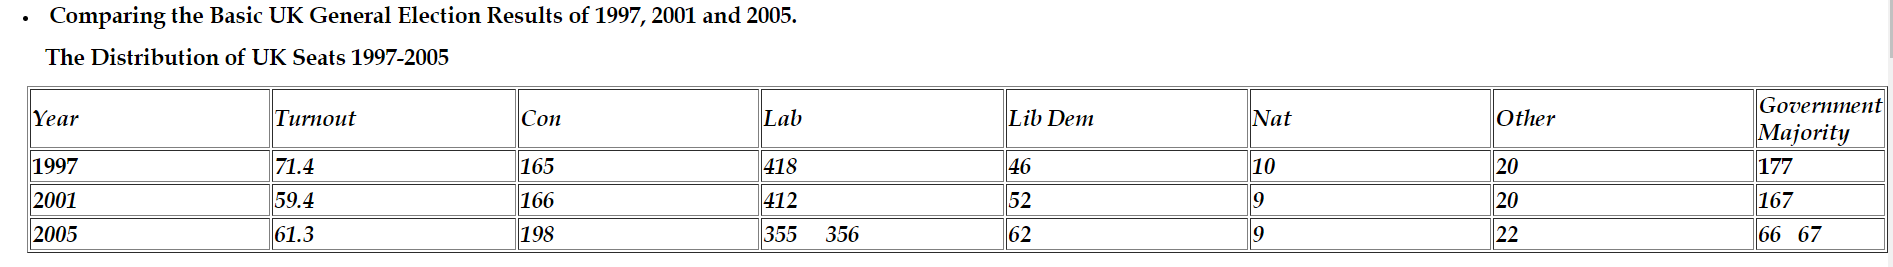
These data are official Electoral Commission statistics reproduced in a House of Commons Library Report of May 2005, updated in March 2006 so that for example they include the result of the postponed Staffordshire South Election. The data show a significant decline in the Labour Government's overall majority combined with a modest advance for the Conservatives and Liberal Democrats. [They show a net gain of seats for the Conservatives of 33 seats but by comparison with "notional" results for the 2001 General Election calculated under the new Scottish boundaries, the Conservatives are considered to have made a net gain of 34 seats.]
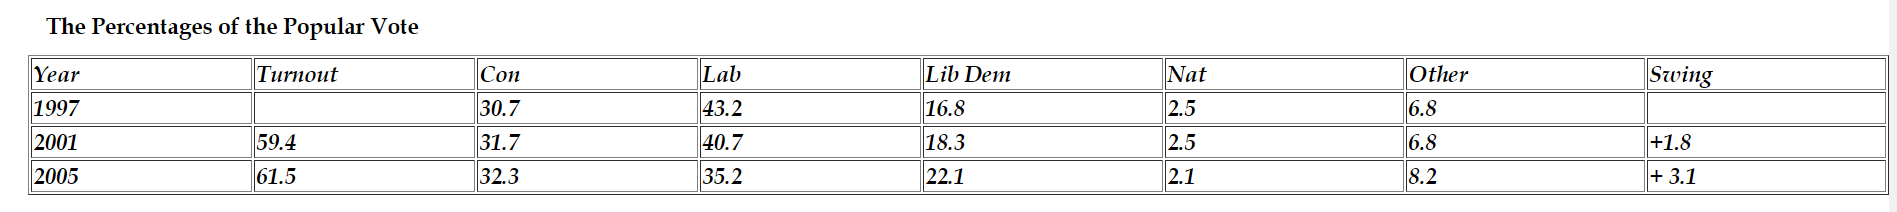 The Percentages of the Popular Vote
These data show that Labour lost 8.0% of the popular vote between 1997 and 2005 but that the Conservatives gained only 1.6% of the popular vote between 1997 and 2005 so that the scale of Conservative recovery , although relatively small in terms of seats, was even smaller in terms of the increase in their percentage of popular vote.
General Election Results and the First Past the Post Electoral System.
It is abundantly clear that the First Past the Post Electoral System discriminates very heavily against the Liberal Democrats and to a lesser extent against the Conservatives in both of which gain a smaller proportion of parliamentary seats than the proportions of the vote cast in their favour.
Further Analysis: Explaining Labour's Relative Electoral Decline from 1997 to 2005
Despite their relatively high opinion poll ratings the Labour Government in general and PM Tony Blair in particular also faced criticisms in 1997-2001. For example It was claimed that Labour were failing to improve the health, education and transport services; that even if rates of income tax had either been reduced [or maintained at a constant level in the case of the highest 40% rate of income tax] other taxes had been quietly in creased such that the overall rate of taxation increased from 35.2% of GDP to 37.3% of GDP between 1997 and 2001; that Tony Blair and other ministers were out of touch and arrogant; that government information was being spun to such an extent that the government as a result was losing credibility; that although there were fewer examples of "Sleaze" under Labour than under previous Conservative governments there were still some; that government money was being spent inefficiently across a range of public services and in particular on the Millennium Dome; and that Labour’s electoral strategy implied excessive concern with the interests of middle class voters at the expense of its traditional more disadvantaged supporters. Furthermore between 2001 and 2005 the rivalry between Tony Blair and Gordon Brown at the heart of the Labour government became increasingly clear and Tony Blair had himself become increasingly unpopular especially once it became clear that no "weapons of mass destruction" would be found in Iraq leading to accusations that Mr. Blair had embroiled the UK in the Iraq War under false pretences.
In order to begin the analysis of labour's relative decline we may concentrate on the relative decline in the popularity of Tony Blair and his leadership team, the relative decline of Labour's image measured according to a wide range of criteria and the relative decline in the popularity of Labour policies for dealing with the most salient electoral issues. In each case we do indeed see relative Labour decline between 1997 and 2005 but what we see also is that in terms of its leadership, image and policies Labour was still preferred to the Conservatives by 2005. all of which helps to explain why Labour won the General Election of 2005 but with a much reduced majority.
- Party Leadership
Although Tony Blair's popularity has declined , voters have rated Tony Blair above John Major, above William Hague , above Ian Duncan Smith and above Michael Howard as the "Best Prime Minister .Click here for relevant data adapted from the IPSOS MORI site. Sheet 1 and Chart1 provide the relevant data. Other sheets and charts at this location provide information on selected aspects of Conservative and Labour Party images.
In a very careful analysis Geoffrey Evans and Robert Andersen conclude that the decline in Tony Blair's popularity between 2001 and 2005 contributed very significantly [and probably more than any other issue to the decline in Labour's share of the vote. [See "The Impact of Party Leaders: How Blair Lost Labour Votes" in Britain Votes 2005 Edited by Pippa Norris and Christopher Wlezien.]
In comparison with the era of Party Identification Party leadership now tends to be seen as a more significant influence on voting behaviour because perceptions of the party leader are seen as a powerful influence on perceptions of overall party competence which in turn is itself seen as a major influence on voting behaviour since this is now influenced more than in the past by valence issues rather than by spatial differences in party policies which in recent years have in any case often been relatively small. However although voters' perceptions of the leader have the greatest impact on perceptions of party competence this will be influenced also by voters' perceptions of other political leaders which are indicated in the following table.
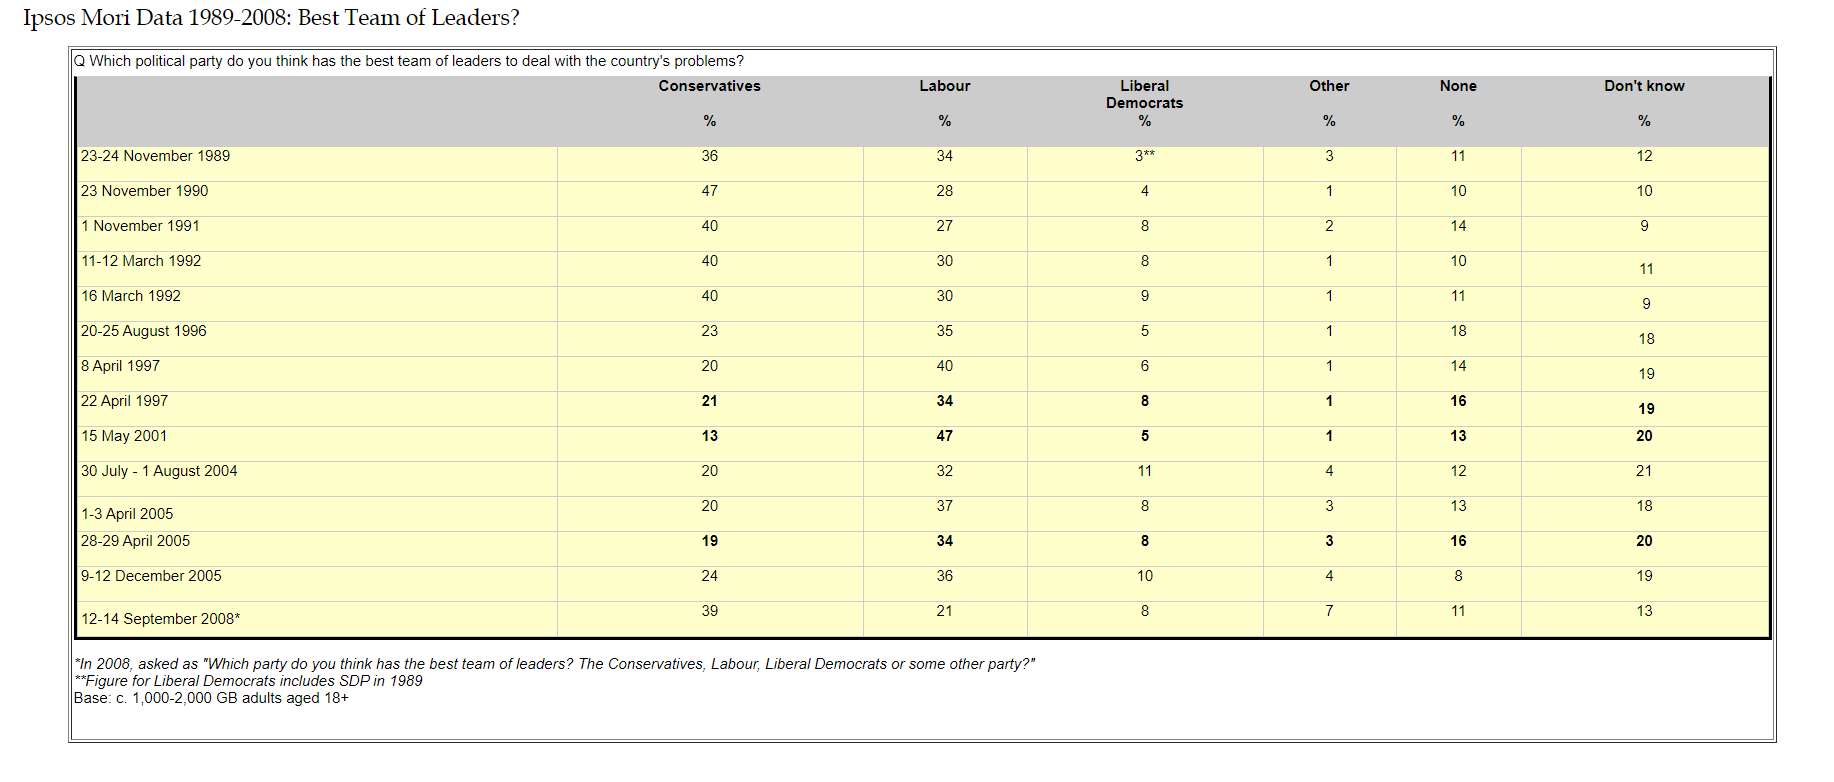
The above data indicate that Labour's leadership team were rated as superior to the Conservative leadership team by a much larger margin in 2001 [47 Labour to 13 Conservative than in 1997 [ 34 Labour to 21 Conservative]. However by April 2005 the Labour and Conservative leadership team poll ratings had reverted approximately to their 1997 levels.
By the way look at the Sept 2008 data and imagine what the data for October 2009 will look like!
Party Images
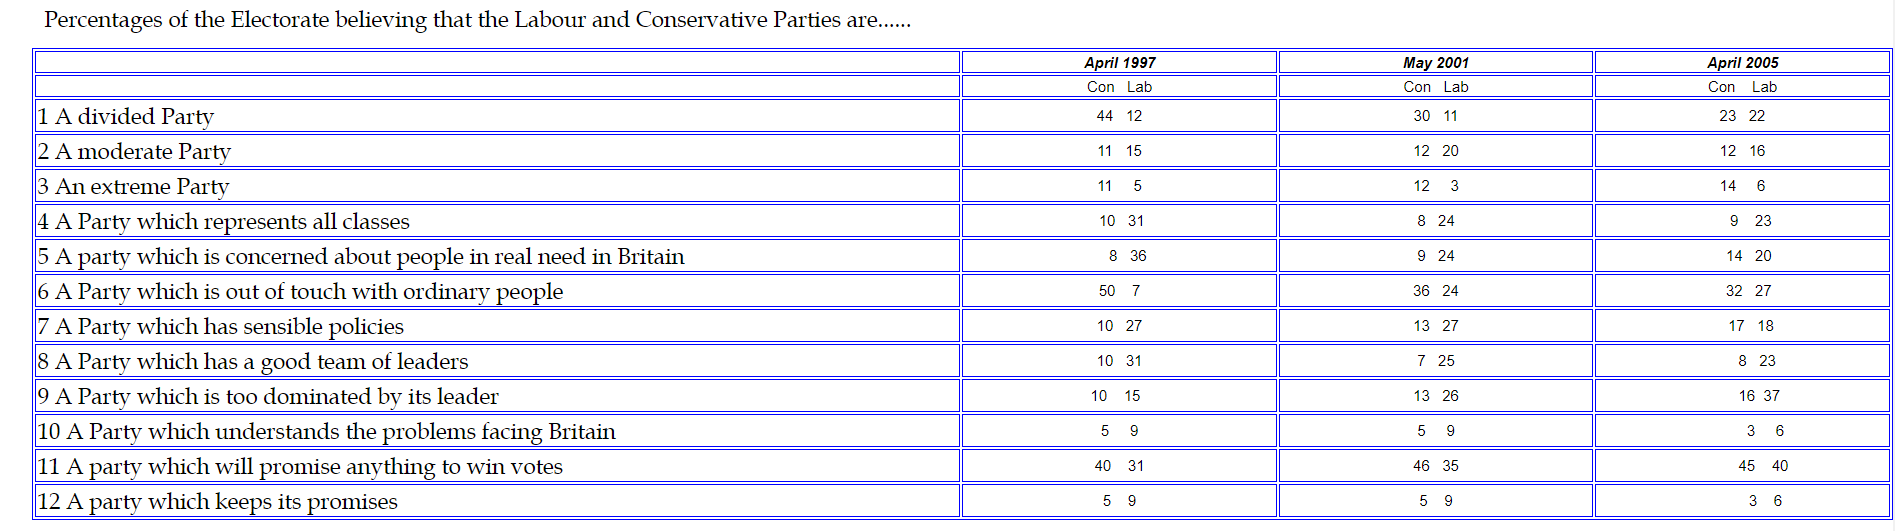
Ipsos Mori publish very detailed trends upon a range of topics relating to the public images of the political parties. I have extracted some of this information in the following table.]
Although Labour's image as measured by several criteria deteriorated between 1997 and2001 and between 2001 and 2005 Labour's image was nevertheless still more favourable than the Conservatives' image by 2005. However note that on several criteria the image ratings of the Labour and Conservative Parties narrowed very substantially. Note also that on some important criteria both parties gained consistently poor ratings [see criteria 10 and 12 below].
Some Data on Party  Identification and Voting Behaviour
Although Party Identification is a weaker than in the 1945-1970 era it nevertheless still influences the voting behaviour of many individuals. From the above data it is clear that in some general elections parties poll above their core levels of support as measured by the Party Identification data and that in other general elections they poll below their core levels of support Perhaps the most surprising statistic is that at around the time of the 2005 General Election only 16% of respondents actually identified with the Conservative Party.
Click here and scroll down for recent data on party identification [1964- 2015] from The UK’s Changing party system: The prospects for a party realignment at Westminster. (David Sanders July 2017)
Spatial Issues and Party Policies
All major polling organisations collect data designed to assess the salience of individual political issues and the electorate's comparative assessments of party policies on these issues but there are several variations in the nature of the data collected in different polls.
- Individuals may be asked to specify the single most salient issue or several salient issues and then be asked to rank party policies on issues which they themselves have specified as important;
- Individuals may be presented with a list of issues and asked to rank them in order of salience and then asked to rank party policies on the issues which they have been provided with.
- Individuals may be asked to rank party policies on particular issues without being asked whether they believe the issues to be salient.
- There are also differences in the wording of the questions asked by the different polling organisations
The data in the above table are taken from various IPSOS MORI publications between 1997 and 2005. Unfortunately I have been unable to find Party ratings collected close to the 2001 General Election. Feb 2001 data were the closest that I could find.
The General Election results of 1997 and 2001 were very similar but Labour's share of the vote and its overall parliamentary majority declined considerably between 2001 and 2005. Commentators noted that enthusiasm for Labour declined even between 1997 and 2001 and this decline certainly continued between 2001 and 2005. The following data provide some evidence that respondents' ratings of Labour policies on the most salient political issues deteriorated between 1997 and 2005
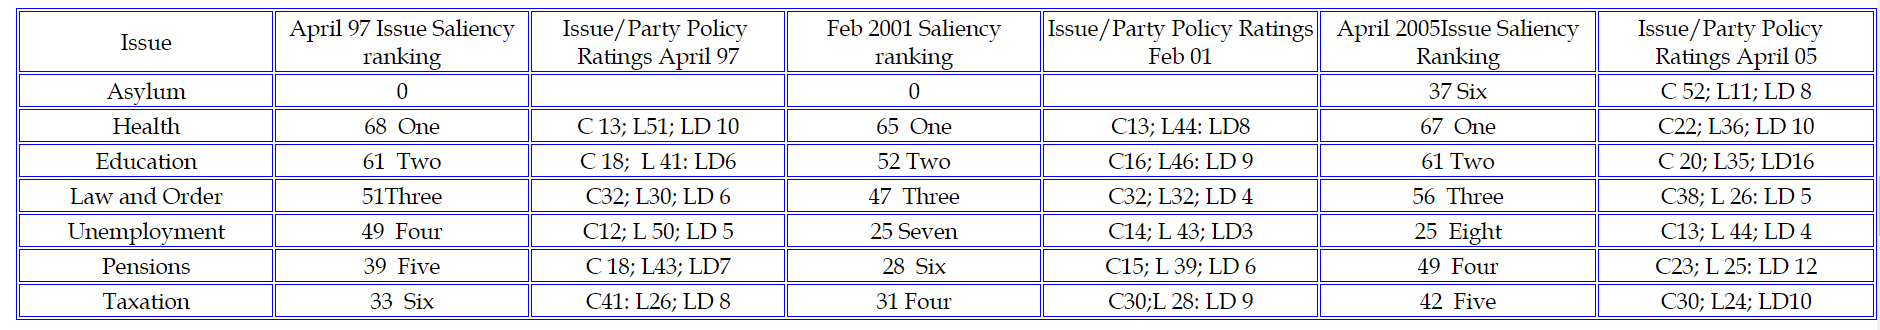
The data in the above table are taken from various IPSOS Mori publications between 1997 and 2005. Unfortunately I have been unable to find Party ratings collected close to the 2001 General Election. Feb 2001 data were the closest that I could find.
- Issues are listed in accordance with their measured salience in 1997 as indicated by the percentages of respondents mentioning particular issues as important influences on their voting behaviour.
- Issue/Party Policy ratings are derived from the answers of respondents who stated that a particular political issue was salient. Thus, for example, in 1997 68% of respondents considered Health to be a salient issue and of these respondents 13%, 51% and 10% preferred Conservative, Labour or Lib Dem policies respectively on the Health issue.
- In the 2001 General Election campaign Conservative leader of the Opposition William Hague faced the dilemma that the Labour Party enjoyed significant opinion poll leads on the most salient issues of the campaign [Health and Education] which led to the anxiety that if the Conservatives even mentioned these issues the publicity might rebound to Labour's advantage. Partly for this reason the Conservatives' campaign focussed, perhaps excessively on Europe and Immigration as a means of illustrating the differences between the Conservative and Labour Parties and the "clear blue water " which divided them. Unfortunately for the Conservatives Europe and Immigration were not especially salient issues for the electorate as a whole and the Conservatives could not expect to make inroads into probable Labour support by concentrating on these issues although Mr. Hague may have thought that election defeat looked increasingly inevitable his strategy might at least help him to retain support among core Conservative voters.
- It can be seen that on the basis of these data there were few major changes in issue salience between the 1997 and 2005 General Elections For example Health and Education are shown as the two most salient issues in 1997, 2001 and 2005.
- It is very important to note that data collected in other surveys by other organisations also illustrate that Health, Education and Law and Order were among the 4 most salient issues of the 2005 General Election campaign but they also suggest that the economy generally was a more salient issue than is suggested in the IPSOS MORI data and in one survey Asylum Seekers and Immigration were considered to be the most salient issue of the campaign
- Notice that Labour's opinion poll lead narrowed on several salient issues. For example prior to each General Election respondents were most likely to prefer Labour's Health policies but whereas in 1997 Labour outscored the Conservatives by 51:13 by 2005 Labour' lead over the Conservatives had fallen to 35: 22. Similarly Labour Education policies were preferred in each General Election but Labour's lead over the Conservatives fell from 41: 18 in 1997 to 35:20 in 2005.
- Just as Labour has traditionally been more popular on both Health and Education, the Conservative Party has traditionally been more popular on Law and Order but one of Labour's successes in the General Elections of 1997 and 2001 was to neutralise the Conservative advantage with regard to Law and Order policies. Thus according to the IPSOS MORI data the Conservatives had only a slight advantage in 1997 which disappeared by 2001 when Labour and Conservative Law and Order policies were rated equally at 32: 32. However by April 2005 the Conservatives were rated significantly higher than Labour at 38: 26 . Perhaps by 1997 the Blairite slogan of "Tough on crime: tough on the causes of crime" resonated less than Mr Howard's question, "Are you thinking what we're thinking?". [Indeed perhaps some people remembered that Mr Howard had a rather tough reputation as Home Secretary in John Major's government and even Ann Widdicombe's barbed remark that Mr Howard "has something of the night about him" may have rebounded to his advantage on law and order questions although it was also suggested that by 2005 Mr. Howard perhaps lost a little energy and now had "something of the afternoon about him".
With regard to points 1-7 above remember that the Issue Voting Model has both strengths and weaknesses which have been discussed elsewhere in a previous document.
The Economy
In a previous document on the General Elections of 1992 and 1997 it was noted that psephologists have developed explanations of the relationships between economic trends and voting behaviour which rely on the distinctions between retrospective and prospective evaluations and egocentric and sociotropic evaluations of economic trends and suggest that it is essential to distinguish between the recent actual performance of the economy and voters, perceptions of recent actual performance and perceived likely future performance under alternative governments. Thus in 1992 the economy was in recession but relatively few voters blamed the recession on John Major's Conservative government, [preferring instead to blame policy mistakes by Mrs. Thatcher's Conservative government and/or world economic circumstances over which UK governments are assumed to have little control] while they also doubted the economic competence of a future Labour government led by Neil Kinnock believing that the economy would deteriorate further if Labour were to be elected.
However, as is well known the Conservatives, reputation for economic competence was seriously damaged as a result of the ERM crisis which helped Labour to open out a significant opinion poll lead which they maintained into the 1997 General Election. The economy did recover significantly from around 1993/4 onwards and Labour's opinion poll lead on the issue of economic competence did decline to some extent but poll evidence indicated that at the time of the 1997 General Election the Conservatives had not recovered their reputation for economic competence and this must have contributed significantly to Labour's victory in 1997.
IPSOS MORI provide the following data on public perceptions of economic management issues in 2001 and 2005.

According to IPSOS MORI respondents " managing the economy" was not considered one of the 6 most salient issues in 2001 nor in 2005 although it is certainly possible that these data understate the salience of managing the economy as determinants of voting decisions especially because issues such as unemployment and taxation were considered to be more salient issues and these issues are clearly related to governments' abilities to manage the economy as a whole and it is also the case that the salience of "management of the economy " was rather higher in some other organisations' polls.
It is generally agreed that between 1997 and 2001 the UK economy performed well as indicted by falling rates of unemployment, low rates of inflation and above average rates of economic growth and whereas the Conservatives had not benefited politically from the improved performance of the UK economy between 1993 and 1997 Labour's reputation for economic competence [and especially the reputation of the then Chancellor Gordon Brown] did improve substantially such that Labour were rated far more highly than the Conservatives on the issue of "managing the economy " in 2001 and between 2001 and 2005 . When Gordon Brown claimed that he had "abolished boom and bust" he was widely believed as few recognised the danger signals that much more difficult economic circumstances were on the horizon.
- The Electoral Significance of the Iraq War.
Opinion Poll data from YouGov suggested that voters rated Iraq as only 11th out of the 12 most salient issues of the campaign and other polling organisations reported very similar if not absolutely identical findings. However there are good reasons to believe that in practice the Iraq war did have a significant effect on the General Election result although it is obviously impossible to quantify its exact significance.
For example , Butler and Kavanagh quote Labour spokespersons who themselves believed that Labour lost 2-3% of their vote share mainly to the Liberal Democrats, as a result of the Iraq war; they quote a Sky News Election day poll which found that fully 25% of Liberal Democrat voters said they would have voted Labour "but did not do so because of Iraq; and they quote a YouGov poll which found that 15% of Labour identifiers voted Lib Dem because of Iraq.
It is likely also that the Iraq War helped to explain several of the Conservative Party's 33 gains. Although the Conservatives gained 33 seats their share of the vote rose by only 0.3% and several of the Conservative Constituency gains occurred despite an actual fall in the number of votes cast for the Conservative party. Such gains may have been caused by switches of previous Labour voters to the Liberal Democrats and/or by abstentions of previous Labour voters , each of which may have been related to the Iraq War. In addition Labour support fell especially in constituencies with a high concentration of Muslim voters.
Furthermore the Iraq war may have had important indirect negative effects on Labour's reputation for unity and trustworthiness and hence on its electoral support
A series of intra-Party disputes arising, for example, from interconnected personal differences between Blairite and Brownite factions and policy differences over Health, Education, Europe and Social Security had begun to erode Labour's image of relative unity [in comparison to the Conservatives] and the Iraq War contributed further to this decline as a result of the Commons revolt of backbench Labour MPs on the votes on the Labour government's decision to invade Iraq and the resignations of Labour Cabinet Ministers Robin Cook [now deceased] and Clare Short and of junior Labour Home Office Minister John Denham.
[nb. UK Prime Ministers may declare war without the support of Parliament but Blair clearly believed that a supportive Commons vote was necessary to help him to persuade the country at large of the necessity of war. The Government's motion " to allow all means necessary to ensure the disarmament of Iraq's weapons of mass destruction" was passed by 412- 149 with Conservative support while 139 Labour MPs voted against this motion and in support of a defeated rebel Lib Dem motion stating that the case for war had not been made. It was nevertheless important for Tony Blair to be able to show that at least a majority of Labour MPs had supported the Government's motion.]
The reputation of the Labour Government and especially of Tony Blair for trustworthiness had gone into decline since 1997 gradually at first but more rapidly after 2001 as a result of the Bernie Ecclestone affair, the scandals surrounding the activities of Ministers such as David Blunkett and Peter Mandelson and the electorate's negative perceptions of the activities of various "spin doctors" operating mainly under the direction of Alistair Campbell [who was the Prime Minister's Press Secretary from 1997 to 2003 and ,having left this post in 2003 ,returned as a significant adviser during the 2005 general election campaign.]
In relation to the Iraq War the Government sought to make its case for military intervention in two significant documents, one of which was quickly shown to have been plagiarised from a rather dated PhD thesis copied from the Internet and the other of which provoked controversies resulting in the death of M.O.D. scientist Dr. David Kelley and the setting up of the Hutton Inquiry, which exonerated the government from any wrongdoing but criticised the BBC to such an extent that the Chairman of the BBC Board of Governors, Gavyn Davies and the Director-General of the BBC Greg Dyke both felt obliged to resign. The subsequent Butler report into the Government's handling of Intelligence material was also relatively uncritical of the Labour Government although it did criticise what it considered to be the excessive informality of the Blair style of government.
Many voters believed from the outset that Tony Blair [either knowingly or unknowingly] had misled them in relation to the existence of Weapons of Mass Destruction in Iraq and Blair's case for war appeared to have been weakened still further once no such weapons were found during the US/UK military occupation of Iraq. Therefore it could certainly be argued that Labour's already deteriorating reputation for trustworthiness was further undermined by many voters' perceptions of the disingenuousness of the Labour Government's presentation of the case for war. Also, although , as has already been mentioned, Iraq did not appear to be a very salient issue for the electorate it certainly was considered salient by the mass media [ranking as the second most covered topic in Press front page articles and editorials and the most covered topic of all by the broadcast media] .
Some campaign difficulties were caused for Labour as a result of the mass media's emphasis on the controversy surrounding whether the Attorney General had been persuaded by government to give advice indicating that the invasion of Iraq would be legal under international law without a second UN resolution. Labour hoped to draw a line under this issue by the publication of the actual advice received from the Attorney General but many were unconvinced by their explanations and in any case the mass media emphasis had prevented Labour from getting onto their preferred electoral issues: education, health and the economy. Even here however it could be argued that Labour's lower ratings for trustworthiness [caused partly by their handling of Iraq] also adversely affected their ratings on Health and Education because even though Labour had spent much more money on Health and Education, many believed that the spending statistics had been "spun" in Labour's favour and that in any case service quality had improved little or not at all and for this reason an increasing number of voters opposed increases in taxation on the grounds that Labour was in any case likely to waste the money.
We see therefore that many voters in key constituencies may well have changed their vote directly as a result of the Iraq issue and that Labour's handling of the Iraq issue may well have affected adversely its reputation for unity, trustworthiness and effectiveness in handling the public services. All of this could have led to a disastrous result for Labour but luckily for them the Conservatives were seen as even less united, even less competent to run the Health and Education services and even less trustworthy. Indeed, having supported Labour's decision to invade Iraq, Michael Howard may have opened himself up to charges of hypocrisy and political opportunism with his allegation that Blair had lied over the case for the invasion of Iraq.
- Social Class and Voting Behaviour in 1997, 2001 and 2005
Psephologists argue that since the high point of class voting in the early 1950s along term process of class dealignment has been occurring whereby middle class voters and working class voters have become decreasingly likely to vote for the Conservative Party and the Labour party respectively: i.e. they have become decreasingly likely to vote for their "natural class parties". Both the measurement and the explanation of class dealignment present considerable difficulties. The measured extent of class dealignment varies depending upon whether the traditional social grade classification [using occupational grades AB, C1, C2 and DE] or the BES class classification scheme are used and also depending upon whether one measures class dealignment via the use of measures of absolute class voting or Alford indices or odds ratios [ which measure {the ratio between the working class Labour vote divided by the working class Conservative vote and the middle class Labour vote divided by the middle class Conservative vote}] .
It is now generally agreed that however class dealignment is measured there has been a long term process of class dealignment from the 1950s to the early 2000s but the actual extent of class dealignment does vary according to the actual measure of class dealignment I have had some difficulty finding a link to data on trends in class dealignment as measured by the methods mentioned above but you may now click here and visit slide 31 of a lecture presentation by S. Fisher which has a diagram from Political Choice in Britain 2004. The Consistency Index referred to in the diagram is [the percentage of working class voters voting Labour minus the percentage of middle class voters voting Labour] plus [the percentage of middle class voters voting Conservative minus the percentage of working class voters voting Conservative.] This means that the Consistency Index = the Labour Alford Index plus the Conservative Alford Index.
If you already have considerable knowledge of the complexities of voting behaviour you should also consult Political Choice in Britain [ a very detailed complex study by H. Clarke, D. Sanders, M. Stewart and P. Whiteley 2004]. Elections and Voters in Britain [David Denver : Second Edition 2007] should be accessible to Advanced Level students perhaps with a little assistance from their teachers and good Advanced Level textbook information is provided, of course, in Sociology Themes and Perspectives [Haralambos and Holborn] .
Because IPSOS MORI present separate statistics for the C2 and DE sections of the working class I cannot calculate measures of absolute class voting nor Alford indices nor odds ratios [because I currently have no data on the relative sizes of the C2 and DE components of the working class] and, furthermore, even if I did have these data my calculations would obviously yield different answers from those calculated on the basis of the BES class classification.
Therefore my own comments on class dealignment in recent general elections must be interpreted with some caution and students are advised to discuss them carefully with their teachers and if possible refer also ,if possible to one or all the three studies mentioned above depending upon the degree of detailed knowledge required. This is very important!!
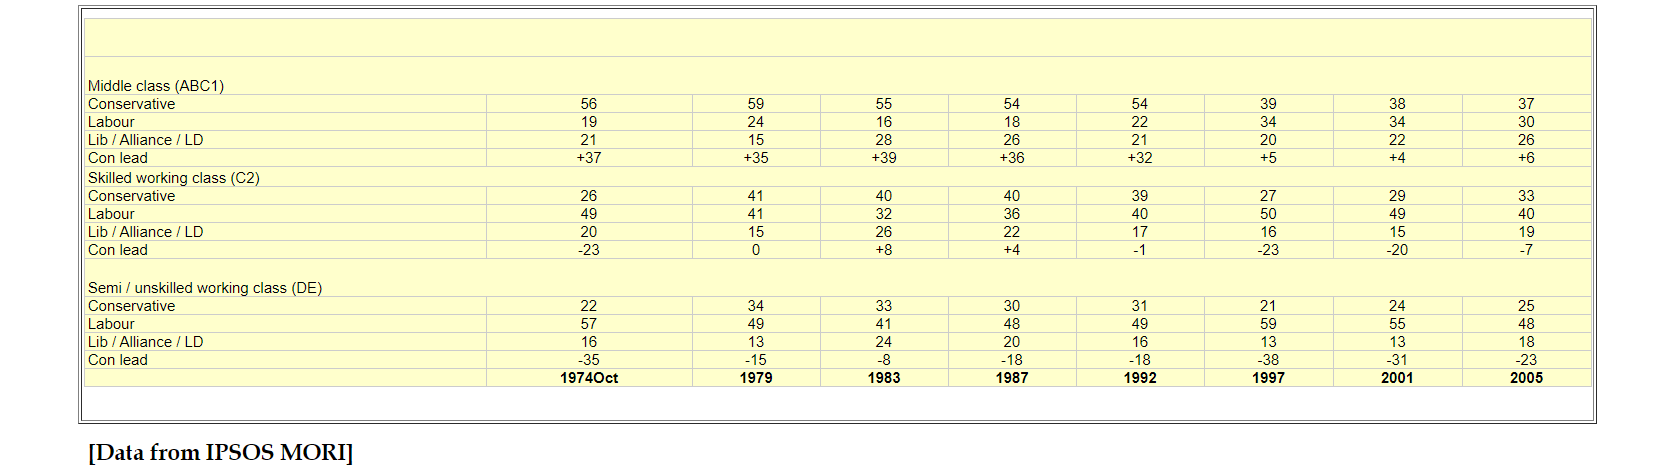
In relation to these statistics we may note the following main points
- Social Class positions are measured in terms of the ABC1, C2 and DE scale. Remember that British Election Studies use a different schema of class classification.
- Working class support [among both C2 and DE groupings] declined significantly between OCT 1974 and 1979 and between 1979 and 1983. It recovered gradually between 1983 and 1992 returning to its 1979 levels by 1992.
- Between 1992 and 1997 working class support for Labour again increased so that by 1997 it slightly exceeded its OCT 1974 levels . New Labour could therefore claim to have recovered much of its support among the working class although this was , of course, still much lower than the levels achieved in the early 1950s at the high point of class voting when approximately two thirds of working class voters voted Labour.
- Between 1974 and 1992 middle class support for the Labour Party fluctuated fairly narrowly between 16% and 24%.
- Between 1992 and 1997 it increased from 22% to 34%. The increase in the percentage of middle class voters voting Labour was even greater than the increase in the percentage of working class voters voting Labour.
- Between 1992 and 1997 some considerable overall class dealignment had occurred as a result of the relative surge in middle class support for Labour and it was argued that the 1997 General Election might possible by a realigning election in the sense that middle class voters had switched from Conservative to Labour in such large numbers.
- Between 1997 and 2001 middle class support for Labour remained stable while working class support [especially among DE voters declined] which suggests further overall class dealignment . {However psephology is fiendishly complicated and it must be noted that BES data based on their different class classification scheme suggest that there could well have been a slight increase in class voting between 1997 and 2001.
- Nevertheless despite these difficult controversies the similarities of voting patterns between 1997 and 2001 suggested that the 1997 General Election may indeed have been a realigning election.
- Between 2001 and 2005 middle class support for Labour declined but by less than working class support for Labour although both working and middle class voters defecting from Labour switched more to the Lib Dems than the Conservatives. There was again a net decline in class voting but the middle class Conservative vote was still much higher than in pre-1997 General Elections still suggesting some ongoing support for the theory that 1997 was a realigning General Election.
- However if the results of the coming 2010 General Election are in line with current opinion polls middle class voters can be expected to return to the Conservative Party in very large numbers and the 1997 realignment will be shown to have been essentially a short to medium term phenomenon.

Note that between 1992 and 1997 and between 1997 and 2001 there were significant declines in turnout such that the 2001 turnout was the lowest since 1918 and that the recovery in turnout by 2005 was small such that it was the 3rd lowest turnout since 1918.
Note also that the combination of low turnout and the relative decline in support for Labour meant that in both 2001 and 2005 the rates of abstention were greater than the percentage shares of the electorate supporting the elected Labour Governments, hardly a ringing endorsement at the polls although, of course support for the Conservatives and Liberal Democrats was even less.
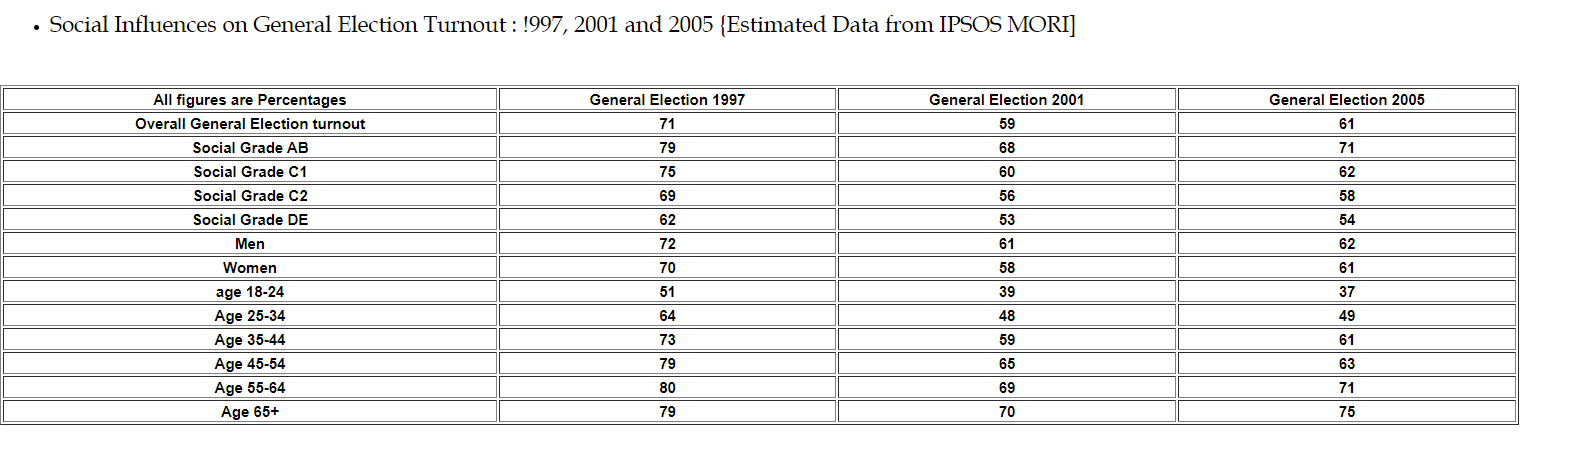
Explanations of the declining turnout between 1997 and 2001 included the following.
- The apparent certainty of a Labour landslide;
- The stage management of the leaders’ tours with speeches for invited audiences of supporters;
- The concentration of the electoral campaign in key marginal constituencies rather than on a fully national basis;
- The failure of the Conservatives to address issues which the electorate considered important;
- The belief among many voters that there was not much difference between the 2 major parties since Labour had moved to the centre under Blair;
- The traditional argument put forward by supporters of proportional representation that under the present electoral system many voters see their votes as wasted and therefore do not bother to vote at all.
- Limited increase in turnout 2001-2005.Limited increase in turnout 2001-2005.
By 2005 another Labour victory seemed very probable if not inevitable. Many voters who had voted Labour with some enthusiasm in 1997 were by 2005 disillusioned with the results of 8 years of actual Labour government while although the Conservatives recovered slightly in terms of their share of the vote many non- voters remained disillusioned with the Conservatives and did not see them as a potential government in waiting.
The issue of declining electoral turnout has been analysed in great detail especially since the especially low turnout of in the 2001 General Election.
In Conclusion
I have now posted 3 main documents on Voting Behaviour in the UK:
- Voting Behaviour in the UK 1945-1970.
- Voting Behaviour in the UK : From the 1970s to the General Elections of 1992 and 1997.
- The General Elections of 1997, 2001 and 2005: Some Comparisons.
I hope that you will find this information helpful as you address essay questions related to alternative models of voting behaviour , the sociological and political influences on voting behaviour, the extent of and reasons for partisan and class dealignment in the UK and the extent of possible realignment especially in the 1997 and 2001 General Elections [although perhaps the 2010 General Election may show that realignment has been short lived]. I hope to post two of my own essays early in the New Year.
- And Finally....
As you look forward [or not] to the result of the 2010 General Election click here for another excellent interactive Guardian Graphic on opinion poll trends 2005-2009
Good luck with your further studies of Voting Behaviour!