Please Note: This revised page is now called Conservative Education Policies 2015 - 2024
This document is divided into Three Sections and Fourteen Parts as indicated below
Related Documents
- Functions of Education: New Right Perspective
- Vocational education and Apprenticeships
- Compensatory Education
- Globalisation and Education
- Social Mobility and Education Policies
- Education Policy and Pupil achievement
- Recent Trends in Educational Achievement: Social Class, Gender and Ethnicity
- Recent data on social class, ethnicity, gender and educational achievement
- The GCE Advanced Level and GCSE Examinations of 2019, 2020, 2021 and 2022
- Click here for a useful revision blast on education policies from tutor2u
- Click here for The Conservatives’ Record on Compulsory Education: spending, policies and outcomes in England, May 2015 to pre-COVID 2020. Ruth Lupton and Polina Obolenskaya
- Click here for The Conservatives’ Record on Social Policy from May 2015 to pre-Covid 2020 and scroll down for links to sections on Higher Education and Social Mobility
|
Issues for Further Consideration
Click here for Compensatory Education Click here for Vocational Education
I have not covered SEND and Early Years Education in the current version of these notes, but I hope to do so in future.
Click hereand here for BBC coverage of Special Educational Needs Click here for the Guardian’s Special Educational Needs Pages Click here for a Guardian Editorial on Special Education Needs Click here for Guardian and here for Channel 4 videos on SEND Click here for IFS Series: Are the kids OK? Part One is on Early Years Education
|
Section One
- Part One: Introduction and Summary Conclusions.
- Part Two Examination Results
- Part Three: Trends in Total Government Spending on Education
- Part Four: Academies
- Part Five: Free Schools
- Part Six: Grammar schools
- Part Seven: Private schools
- Part Eight: The Schools Admission Code
- Part Nine: OFSTED Inspections
- Part Ten: Higher Education
- Part Eleven: Poverty and Free School Meal Eligibility
- Part Twelve: The effects of COVID 19 and the Education Recovery Programme
- Part Thirteen: The 2022 Education White Paper
- Part Fourteen: Conclusions: Education Policies and Social Mobility
Part One: Introduction and Summary Conclusions
Within the UK responsibilities for education are devolved to Scottish, Welsh, and Northern Irish authorities and the information in this document relates primarily to the recent policies which UK governments have introduced to modify the English education system. In their survey of The Conservatives’ Record on Compulsory Education: spending, policies, and outcomes in England: May 2015 to pre-COVID 2020 Ruth Lupton and Polina Obolenskaya state that policy developments in in the compulsory education sectors between 2015 and 2020 have broadly continued the direction of travel taken by the Coalition Government of 2010-2015. It can also be argued that Coalition education policies followed principles which had been espoused by Conservative Governments of 1997-2010 and accepted, albeit with some significant modifications by Labour administration of 1997-2010.
It has also been argued that the globalisation process does impose a need for educational reform if countries are to improve their competitiveness within the globalised world economy. To improve their competitiveness countries must: increase the overall efficiency of their education systems, provide for effective vocational education partly via the expansion of Further Education. and prioritise the expansion of Higher Education.
Also, globalisation is likely to result in increased immigration which means that via the education system facilities must be provided for many new immigrants to learn English and in general to develop their capacities to the full.
Education policies have also been influenced o by the perceived threats of international terrorism leading in the UK to the Prevent programme and by the global spread of the Covid 19 pandemic leading to the development of an education recovery programme. Further resources on Globalisation and Education may be found here.
A key feature of education policy especially since the Education Reform Act of 1988 has been the quasi-marketisation of education which according to its supporters would enhance school diversity and parental choice, facilitate the expansion of effective schools and the closure of ineffective ones and lead to improved standards for all pupils including those from the poorest backgrounds. Furthermore, it was argued that the process of quasi -marketisation would generate a "parentocracy" whereby individual parents would have far greater individual choice in determining the schools which their children would attend. The quasi- marketisation of higher education was similarly expected to improve its overall quality.
However, several education policy analysts were critical of the neo-liberal approach was indicated especially in the work of Ball, Bowe and Gerwitz. In their study "Markets, Choice and Equity in Education " [1995] Ball, Bowe and Gerwitz criticised Conservative education policies designed to provide parents with a wider choice of schools for their children because in their view middle class parents and their children would be especially likely to benefit from this choosing process because they possess the cultural and economic capital to choose more effectively. Regarding parental choice, Gerwirtz, Ball and Bowe distinguish between mainly middle class "privileged choosers" and mainly working class "semi-skilled and disconnected choosers" admitting however that these categories are, to some extent ideal types and that many parents may be difficult to classify exactly. Nevertheless, according to Ball, Bowe and Gerwitz it would be the middle class "privileged choosers which would gain most from the Conservative reforms. designed to increase parental choice which would obviously undermine claims that "parentocracy rules" in the education system. These conclusions are reiterated in recent reports work from the Sutton Trust. Click here for Parent Power [2018] and here for School Places: A Fair Choice? [2020]
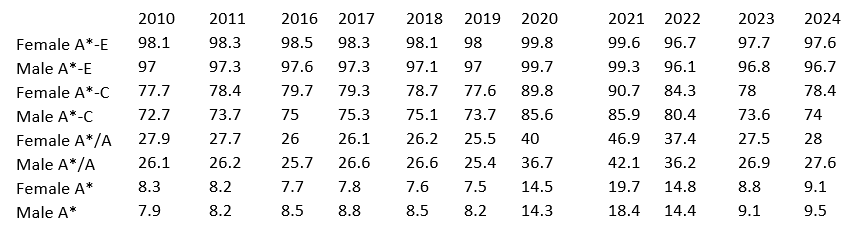
Nevertheless, supporters of the quasi-marketisation strategy in the UK have argued that overall school effectiveness has increased. Initially this resulted in improved GCSE and GCE Advanced Level results although in recent years governmental concerns with grade inflation have restricted further improvements in examination results. Nevertheless since 1979, according to their supporters, the success of these policies has been indicated by the increased overall access to Higher Education including greater access for working class and ethnic minority students and it is noted also that the introduction of the National Curriculum and specifically the categorisation of Science as a compulsory subject at GCSE Level increased female entries for GCSE Science subjects and subsequently for GCE Advanced Level Sciences although they have remain for less likely than boys to opt for GCE Advanced Level Physics.
It is suggested also that the quasi -marketisation of education has contributed to the rise of England in various international tests such as the PISA and TIMMs tests although as indicated here not everyone has been convinced by this argument .
Sociologists would analyse the education policies of Conservative and Labour, Coalition and subsequent Conservative governments from different sociological perspectives. From Functionalist and New Right and perspectives Conservative education policies and some Labour education policies would be seen as beneficial to pupils while Labour's policies would be supported especially by moderate social democratic theorists although they might also fear that New Labour's education policies have been influenced by New Right ideas in ways which inhibit the likelihood of increased meritocracy and Interactionist theories could be used to suggest that any education policies which promoted negative labelling would also undermine meritocracy. Marxists would be critical of both Conservative and Labour policies as inevitably supportive on an unequal, unjust capitalist system and while Liberal Feminists would recognise the usefulness of some Conservative and Labour policies, Marxist/Socialist and Radical Feminists would be more likely to emphasise the limitations of these policies. I have outlined these competing perspectives elsewhere on my site and they should certainly be borne in mind in the consideration of the Conservative Education Policies of 2015-2024
I shall outline the main education policies of Conservative Governments 2015-2024 in subsequent sections of this document but before doing so I provide a checklist of summary conclusions which I hope students will find useful. Students should then take advice from their teachers as to how much time to spend familiarising themselves with some of the more detailed information as it will not be possible to incorporate many such details into examination answers!
Check List of Summary Conclusions
- Key Stage 1 and 2 results, GCSE and GCE Advanced Level results are outlined in Part 2 of this document.
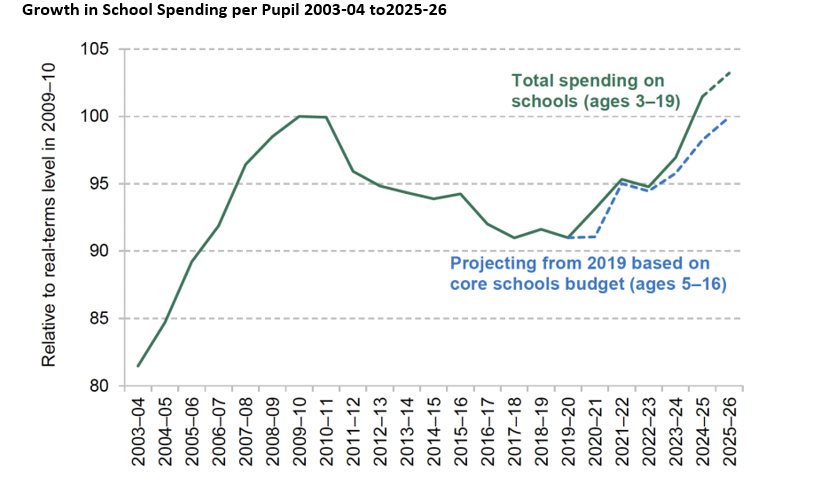
- Total School spending per School pupil fell by 9% between 2009/10 and 2019/20 in real terms and did not return to its 2010 level until 2024 thus indicating that there was no real increase in education per school pupil for 14 years.
- Between 2009/10 and 2019/20 the reductions to education spending per pupil which have occurred have fallen more on the schools with the most deprived pupils [14%] than on schools with the least deprived pupils [9%].
- The Academies Programme has expanded. Many academies are performing well but some recent data suggest that on average council-maintained schools are performing better than academies. In general, it is difficult to assess the relative effectiveness of Academies and local authority- controlled schools.
- The Free Schools Programme has expanded but as of 2025 they accounted for only 3.4% (740) all state maintained schools in England.
- OFSTED data indicate that they are more likely than other state schools to be judged outstanding but their Results at Key Stage 2 in 2019 were worse than in other state primary schools and their superior performance at secondary school level is accounted for partly, but not entirely by differences in school intakes. There was a negligible relative improvement in the attainments of disadvantaged pupils in free schools and this may have been due to chance. Further information on the effectiveness of Free Schools is provided later in this document.
- Theresa May was especially keen to increase the number of grammar schools but was prevented from doing so due to her necessary preoccupation with Brexit negotiations. The case for Grammar schools remains unproven.
- Private schools continue to exist and continue to serve mainly children from relatively affluent families.
- Ofsted data indicate that the proportions of schools judged outstanding or good are increasing and its supporters believe that Ofsted inspections have themselves contributed to this improvement. However, critics of Ofsted believe that it “requires improvement” [!] and in some cases that it should be abolished completely, a view which its supporters of course reject.
- Click here and here for items on Ofsted from The Briefing Room [BBC Radio 4] Reforms of the OFSTED inspection process are ongoing
- The School Admission Code was introduced by the Labour Government in 2007 and successive governments have introduced variations of the Code in attempts to reduce the social selectivity of schools and hence to increase equality of opportunity. Reports by the Sutton Trust in 2018-20 suggested that social selectivity remained a problem and a new School Admissions Code was introduced by the Conservative Government in 2021. However, it seems likely that considerable social selectivity will remain a problem for the foreseeable future.
- There are ongoing efforts to improve the provision of vocational education and apprenticeships, for example via the introduction of T Levels and Advanced and Higher Apprenticeship schemes. These are discussed here.
- Access to higher education has increased significantly including among disadvantaged students. However there remain significant social class differences in access to higher education and especially in access to higher status universities.
- The financial difficulties of many Higher Education Institutions have increased in recent years.
- There have been suggestions that there should be some redirection of resources away from higher education and toward further education.
- Official data indicate that there has been some reduction in levels of absolute poverty, but levels of relative poverty remain high and are likely to increase due to the current cost of living crisis. High levels of relative poverty impact severely on the educational prospects of disadvantaged pupils.
- Disadvantaged pupils suffered disproportionately because of the Covid 19 crisis, and it is estimated by the Education Endowment Fund that the effects of the pandemic were probably to reverse much of the closure of the disadvantaged pupils’ attainment gap which had occurred since 2011. Click here for Guardian coverage of the EEF Report,
- There have been serious problems surrounding the Educational Recovery Programme and especially around the National Tuition Programme.
- There were significant problems around examinations in 2020, 2021 and 2022. Grades improved significantly when examinations were cancelled in 2020 and 2021 but have returned to their pre-pandemic levels by 2024
- The Government published an education white paper in 2022. It was not without its criticisms and was withdrawn partly because the UK Government faced more pressing problems in December 2022.
- We are where we are. It is questionable whether the educational policies of Conservative Governments 2015-2022 will contribute significantly to increased social mobility in the future, but it is, of course, too soon to know.
- Part Two Examination Results
For further details Click here for The Conservatives’ Record on Compulsory Education: spending, policies and outcomes in England, May 2015 to pre-COVID 2020. Ruth Lupton and Polina Obolenskaya and scroll down to pages 36- 52.
Pages 35-38 of this report indicate that Key Stage 2 results improved between 2016 and 2019 and these results are analysed in some detail in the report.
More detailed information on the Phonics Screening Check and Key Stage 1 assessments 2016-2019 may be found here . The data indicate that Key Stage 1 Teacher assessment results improved in Reading, Writing and Mathematics but not in Science between 2016 and 2019 although in any case the 2018/19 data are not comparable with previous years. Girls outperformed boys in Reading Writing and Mathematics, but the gender gap was smaller in Maths than in Reading and Writing. There was a significant attainment gap as between disadvantaged and non-disadvantaged pupils of 17-18% in all subjects and this gap changed little between 2016 and 2019. You may also click here and then on Key stage 1 tables for more detailed information including differences in results by ethnicity.
You may Click here for similarly detailed analysis of the 2024 results
More detailed information on the Key Stage 2 tests/teacher assessments 2016-2019 may be found here. The data indicate that results in Reading, Maths, GPS, Writing and Science all improved but that the biggest improvements were between 2018 and 2017. As at Key Stage 1, Girls outperformed boys in all subjects although the gender gap in Mathematics was small and boys outperformed girls at the higher standard in Mathematics but not in the other subjects. There was again a significant attainment gap between disadvantaged and non-disadvantaged pupils, but the disadvantage gap did fall between 2011 and 2019. Unfortunately, however, it is likely that because of Covid 19 this fall in the disadvantage gap 2011 -2019 has been entirely wiped out. You may also click here and then on National. local authority and regional tables for more detailed information including differences in results by ethnicity.
You may Click here for similarly detailed analysis of the 2024 results
In recent years until 2020 annual overall pass rates and grade distributions at both GCSE Level and GCE Advanced Level have been relatively stable because the overall pass rates and grade boundaries have been manipulated to achieve comparable outcomes: that is to try to ensure that “if the cohort of students taking a qualification in any one year is of similar ability to their predecessors, then overall results should be comparable.” Thus, the distribution of A level grades in any one year will be very closely related the distribution of GCSE results two years previously although the distribution of A level grades can be modified slightly if expert examination scrutinisers believe that this is justified. However, the overall effects of the comparable outcomes procedure is that year on year variations in GCSE and GCE Advanced Level results are likely to be small. This procedure has been adopted to remove the possibility of pass rate and grade inflation.
However due to COVID and the cancellation of examinations in 2020 and 2021 these procedures were not adopted and as a result higher level GCE Advanced Level and GCSE grades both increased substantially, but once GCE Advanced Level Examinations were reintroduced in 2022 GCE Advanced Level grades were managed to ensure that they would gradually return to their pre-Covid levels.
You may click here for an explanation of comparable outcomes from Schools Week 2015 and click here for a detailed OFQUAL publication from 2020 and here Schools Week coverage for an interesting dispute as to when Comparable Outcomes were first introduced.
Click here for bar chart of these data.
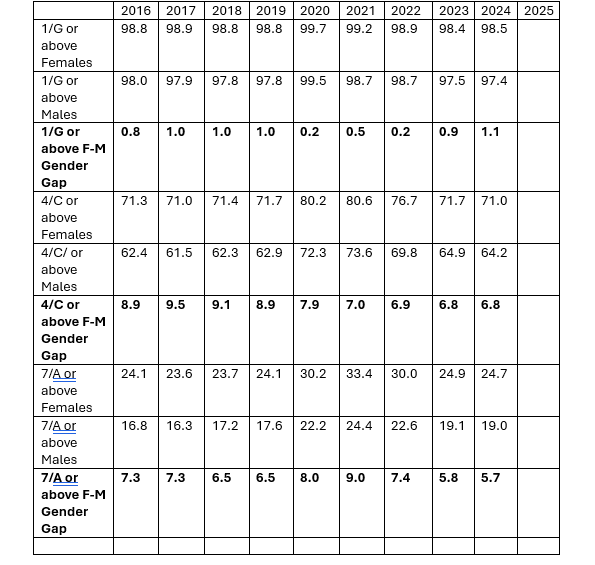
As with GCE Advanced Level results the pattern Of GCSE grades remained relatively stable between 2016 and 2019 but when the examinations were cancelled the percentages of passes at grades 4/C and above rose significantly 2020 onwards. They then returned gradually to their pre-Covid levels once examinations were reintroduced in 2022
Click here for further details surrounding the GCSE and GCE Advanced Level examination of 2020 and 2022
- Part Three: Trends in Total Government Spending on Education in England
- In the analysis of education policies, it is important to consider overall trends in total education spending, the distribution of total education spending among the different sectors of education, the specific issues affecting the different sectors of education and the requirements of students with special needs at all levels of the education system. Some very detailed technical issues are involved here, and, in these notes, I have extracted some summary points from IFS Reports and included some links to Guardian and BBC articles which I hope might provide Advanced Level Sociology students with some useful background for their studies of education policies. I refer briefly to total UK Education Spending and to its distribution between different sectors but concentrate primarily on UK spending on Schools.
- Total Public Spending on Education
- Click here for IFS Annual report on education spending in England 2024-25
- Click here for the IFS Video Presentation of this Report
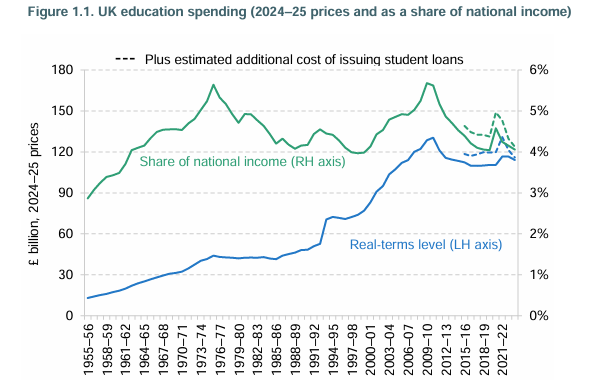
The IFS Report states that “In 2023-4, total public spending on education in the UK stood at £116Billion [including the net cost of issuing student loans and in 2024-5 prices]. This represents an 11% or nearly £15Billion fall since 2010-11 and represents the level in real terms as in 2006-7. This drop mostly reflects the shift in the cost of higher education from the taxpayer to graduates over time.”
“Education spending has also fallen as a share of national income from about 5.6% of national income in 2010-11 down to about 4.1% in 2023-24. This equals recent historic lows seen in the late 1990s, late 1980s and mid-1960s. There has been no long-run increase in the share of national income devoted to public spending on education spending despite large increases in education participation in the long run.”
Source: HM Treasury Public Expenditure Statistical Analyses 2024, and previous versions; HM Treasury (2024); Office for Budget Responsibility, Economic and Fiscal Outlook, various editions (https://obr.uk/efo/); Office for National Statistics, ‘Student loans in the public sector finances: a methodological guide’, January 2020 (https://www.ons.gov.uk/economy/governmentpublicsectorand taxes/publicsectorfinance/methodologies/studentloansinthepublicsectorfinancesamethodologicalguide).
Recent Data on the Distribution of Education Spending Between Different Education Sectors
Click here for Schools and Colleges in the 2025 Spending Review
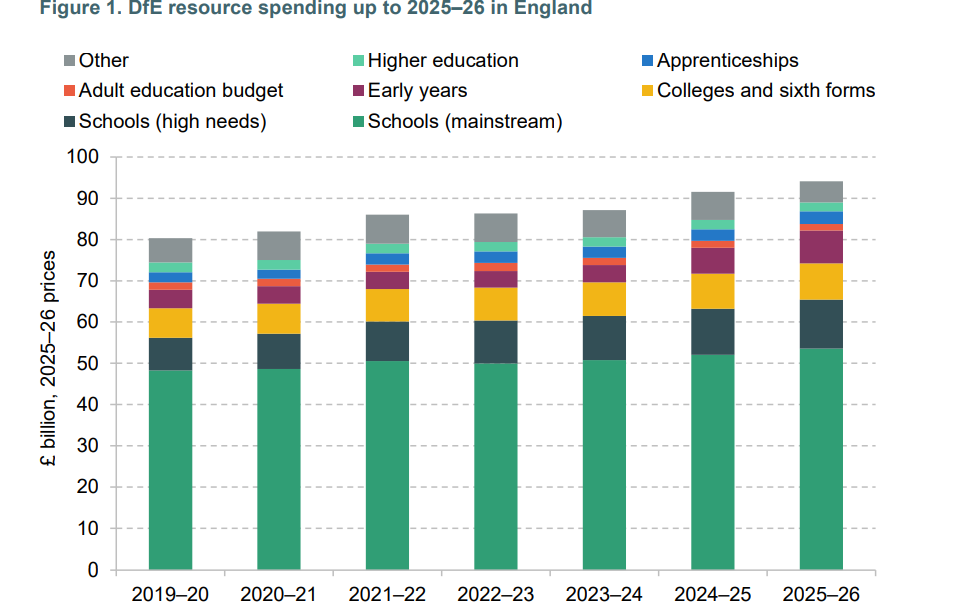
The above diagram shows how Education Spending in England has been distributed among the different sectors of Education in recent years. In this section of the notes, I shall be concentrating on Schools expenditure but some information on Higher Education policies can be found here
In relation to this diagram note the following points
- In 2024-25 [at2024-25 prices] total education spending stood at £116 billion or 4.1% of national income. It was the second largest category of government spending behind Health spending Total education spending rose significantly both absolutely and as a percentage of national income under Labour Governments 1997-2010 but then fell sharply because of the austerity policies imposed in the aftermath of the financial crisis. Education spending did increase slightly during the Covid pandemic, but this was followed by another decline in the final years of Conservative Government. The incoming Labour Government announced plans to increase Education spending.
- To calculate trends in real spending per pupil, it is necessary to take account of rates of inflation. However, there are times when the national rate of inflation exceeds the rate of inflation in the schools sector and times when the revers is the case.
- In recent years there has been a significant increase in the number of pupils with Special Needs and Disabilities [SEND] which has placed significant additional pressures on school Click here for Special Needs Funding
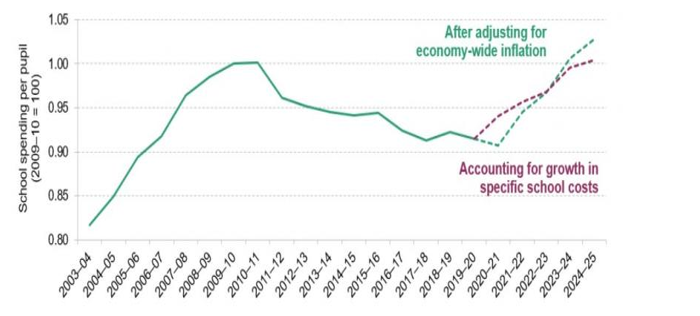
- The IFS has estimated that by 2024-25 once the effects of increases in school costs were taken account of total funding per pupil was lower than when adjusted to take account of economy wide inflation. When account is taken of school cost increases it is estimated that by 2024/25 total school spending per pupil returned to its 2009-10 level.
- Between 2009/10 and 2019/20 the reductions to education spending per pupil which have occurred have fallen more on the schools with the most deprived pupils [14%] than on schools with the least deprived pupils [9%]. This has arisen due to the nature of the formula funding system in operation and because the uprating of pupil premium has not kept pace with inflation since 2015. This point will be considered in more detail below.
- Also, between 2009/10 and 2019/20 while real terms education spending per pupil in state schools has fallen by 9% real terms tuition fees per pupil in private schools have risen by 23% thus increasing the gap between spending per pupil in state schools and in private schools from £3100 to £6500 Click here for public school and state school data to 2021/22 from the IFS.
- It is pointed out that the adverse effects of COVID have impacted disproportionately on disadvantaged students and that although the Government has allocated £ 4.9 billion in England to its COVID Educational Recovery Plan but its original Covid Education Recovery Commissioner [who subsequently resigned] had originally recommended the Government to spend £15 Billion.
- These trends in total education spending per school pupil may well have inhibited government efforts to level up educational opportunity.
- In addition an Observer article of May 2022 has highlighted that relatively low overall levels of government spending in the last 10 years have included low levels of capital spending which means that many school buildings are in varying states of disrepair and that the Department of Education are currently in discussions with the Treasury of their need for additional funding to repair school buildings.
- Click here for a Guardian summary of the financial difficulties facing the school system as of 2022
The Impact of the Schools National Funding Formula
Click here for the Sutton Trust Report On The Opportunity Index [May 2025]
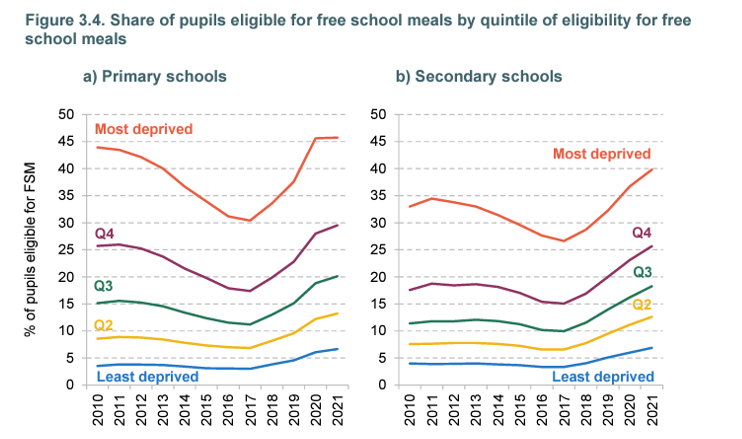
The IFS analyse the National Funding Formula in detail, and it is noted that deprived schools [as measured by the proportions of pupils eligible for free school meals] have traditionally been allocated greater funding such that in 2010-11, spending per pupil in the most deprived secondary schools was 34 % higher than in the least deprived secondary schools but that by 2019-20 this gap had fallen to23%. In primary schools, the gap fell from 35% to 23%
Click here for more detailed information on this issue taken from pp49-53 of the IFS Annual Report on Education in England 2023
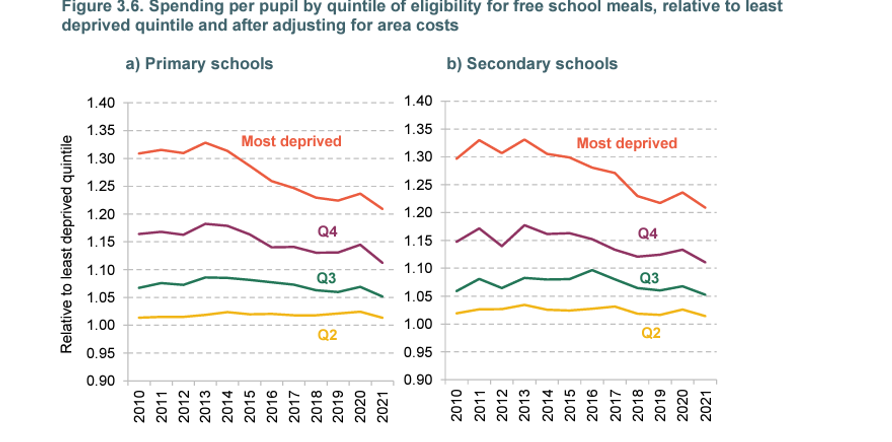
The following diagram then shows that, for primary and secondary schools, between 2017-18 and 2022-23, increases in school funding were skewed even more toward less deprived schools which means that although more deprived schools continue to receive larger funding than least deprived schools the extent of their funding advantage has continued to decline steadily. [ It is then noted that “the most deprived schools outside London have seen the largest spending cuts over the period [2010;11- 2019/20] with 15% real terms fall in spending per pupil amongst the most-deprived secondary schools outside London. This is naturally a concerning pattern given that these are the other areas with the lowest educational outcomes and potentially the highest extent of any “unmet need”.
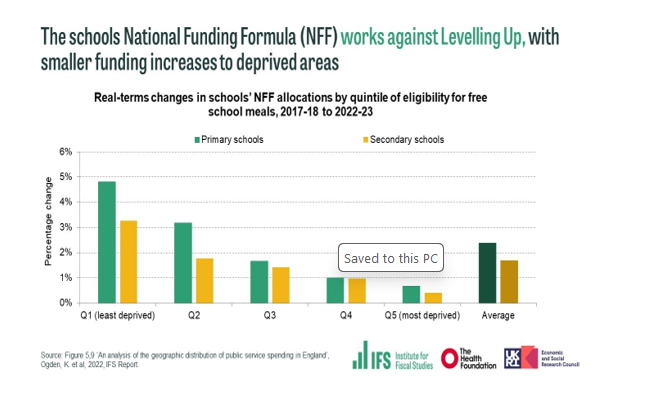
The above chart indicates that as of October 2022 spending increases have been smaller for schools in most deprived areas than for schools in least deprived areas as measured by Free School Meal Eligibility
Part Four: Academies
What are academies and free schools and how do they differ from maintained schools? In England, academies and free schools are state-funded, non-fee- -paying schools independent of local authorities. They operate according to their funding agreement between the individual academy trust and Secretary of State. Maintained schools, in contrast, are so called because they are ‘maintained’ by the local authority; the local authority has varying degrees of involvement dependent on the subtype of maintained school.
The general arguments in favour of academisation are that in the case of Sponsored Academies the sponsors who might be business, churches, charities, or universities would be able to apply their expertise effectively in school settings to raise school efficiency and that Converter Academies which initially were schools judged outstanding by OFSTED it was argued that these schools would benefit from the greater autonomy allowed by academy status. Subsequently other less effective schools would benefit from academisation via partnership with more effective schools and the setting up of Multi-Academy Trusts would enable best practices to be implemented by all members of each Trust. The growth of academisation would feed into the overall quasi-marketisation of education which through competition for pupils would increase the overall efficiency of the school system. However, critics of academisation were certainly not convinced.
The Coalition Government's approach to Academisation has differed in several important respects from the Academies programme of previous Labour Governments.
- In June 2010 the Coalition Government announced that all Secondary, Primary and Secondary Schools would eventually be permitted to apply for Academy status, but that priority initially would be given to schools judged outstanding by OFSTED whose applications would be accepted automatically. Subsequently from November 2010 schools judged good but with outstanding features were also invited to apply and their applications would be assessed by DFE officials. These Schools were defined as Converter Academies
- Other Schools were then invited to apply but only if they were joined in a partnership with schools judged outstanding or good with outstanding features or partnered with an alternative high performing educational institution.
- Meanwhile schools deemed to be failing might also be compelled to become Sponsored Academies as under the previous Labour scheme.
- The House of Commons Education Select Committee reported on Academies and Free Schools in 2015. [Click here for the full Report and scroll to Section 2 pp 10-24 for the section on Academisation and Pupil Progress]
The members of this committee have been advised by Professor Stephen Machin who has himself conducted important and highly respected research on the possible effects of academisation on pupil attainment some of which is summarised in my own summary document on Academies. The Committee concentrate their research primarily on the effects of sponsored academisation on pupil progress arguing that it is too soon to assess the effects of the Converter Academies.
Their key conclusion is that "Current evidence does not allow us to draw firm conclusions on whether academies are a positive force for change. According to research we have seen, it is too early to judge whether academies raise standards overall or for disadvantaged children. This is partly a matter of timing. We should be cautious about reading across from evidence about pre-2010 academies to other academies established since then."
Be that as it may recent data indicate that the expansion of academies [and Free Schools which had also been introduced by the Coalition Government] has continued rapidly since 2015 and compulsory academisation of all schools by 2022 was proposed in 2016 although the proposal was quickly discarded in favour of “sweeping powers for the DFE to force schools in “underperforming” local authorities to convert to academy status.”
Government spokespersons continue to argue that Academies and Free Schools have the potential to improve overall educational standards and it is true that some academies and free schools are very successful. However, some are not successful and on average there is little differences in the overall attainments of Academy pupils and pupils from local authority schools. Critics have variously argued that there is no necessary reason why expertise in non-educational settings might improve the overall effectiveness of schools; that the organisation of academies especially within Multi-Academy Trusts limits parental involvement in schools’ organisation; that the occasional collapse of multi-academy trusts results in the creation of so-called “Zombie Schools with no overall management structure; that salaries of chief administrators of Multi-academy trusts are excessive; that the system of Regional Commissioners set up for the control of academies is inefficient; that there have been occasional cases of suspicious financial practices; and that the quasi-marketisation of education serves to increase inequality of educational opportunity without necessarily improving overall educational standards.
I reiterate that some Academies and some Multi-Academy Trusts are performing well and you may Click here and here and here and here and here and here for support for academies
However, some of the criticisms of the Academies Programme are illustrated via the following sources.
Schools judged unsatisfactory by Ofsted are still obliged to become academies even when this is against parents’ wishes and it is reported here that between 2016 and 2019 314 primary schools were forced to become academies and this article indicates that controversies over forced academisation continue
Click here for “Academies without parents on boards “risk community rejection” [ Guardian 2019]
Click here for 53,000 pupils in limbo after rise in “zombie “academy trusts. [Guardian 2019
Click here for Academy chains underperforming for disadvantaged children, study finds [Guardian 2018]]
It is reported here that in 2019 maintained [i.e. local authority controlled ] schools actually outperformed academies in SATs taken at the end of year 6.
Click here for a critical assessment of academies. [Guardian 2019]
Click here and here for coverage of a critical assessment of government education policies from the University College London Institute of Education [2018]
Notwithstanding these criticisms the then Secretary of State for Education Gavin Williamson reiterated his support for further academisation in April 2021 as indicated here but his policy was criticised by school leaders who were especially critical of forced academisation Nevertheless, in March 2022, the new Secretary of Stare Nadhim Zahawi has stated that
“I see the future as involving all schools being part of a strong trust, and I will say more about this in my white paper. “What I will say now is that I underline the word ‘strong’, because we mustn’t sugar-coat this – some trusts are not high performing. The white paper will set out how I plan to deal with that challenge as well.” Then it was announced in the March Whitepaper that “By 2030, all children will benefit from being taught in a family of schools with their school in a strong multi academy trust or with plans to join or form one”
Once again, the word “strong” was included but still some critics argued that Mr Zahawi was overstating the benefits of academisation. For example a recent article in Schools week based on research by Acknowledged expert Professor Stephen Gorard suggested that “The “evidence -led education secretary” isn’t being led by the evidence.” Also a recent Guardian article has referred to recent research suggesting that council- maintained schools are outperforming academies.
In any case this Education Bill was fairly quickly scrapped and you may Click here for Guardian coverage and here for BBC coverage of the scrapping of the Education Bill [December 2022] which left the exact future organisation of the academies system a little uncertain. However a useful article published in Schools Week [February 2023] indicated “Schools Week understands the specific ambition from the white paper- that schools would either have joined or be joining a trust by 2020- has officially been dropped” and that plans for local authorities to set up their own academies have also been dropped. Currently 53.5% of primary schools and only 16.5% of secondary schools are local authority maintained schools (March 2025)
Controversies would soon arise around the extent to which the incoming Labour Government might seek to reduce some Academy freedoms, but these controversies will be addressed in a future document!!
Academies, Ofsted Inspections and Examination Results.
Click here for a Schools Week article on the complex relationships between examination results and Ofsted inspection ratings.]
From the very beginnings of the original Academies Programme comparison of the examination performance of Academies and Local Authority controlled schools has presented some problems in that Academies for example include both Sponsored Academies [which became academies in the first place partly because they were delivering lower than average examination results] and many converter academies which will have had better than average examination results before they converted to academies. These issues and others are carefully addressed in a recent []April 2022] Schools Week article by Professor Stephen Gorard. However other experts have argued that the Sponsored Academies set up by the Labour Government between 2000 and 2010 did have beneficial effects on pupil progress.
There have also been attempts to compare relative Ofsted ratings and most recently analyses have been published which suggested that local authority maintained schools have been out- performing academies. However, it has also been suggested that these analyses have neglected some important details which therefore invalidates the results of the studies.
Click here and Click here for Guardian articles from 2022 and 2023 on Ofsted ratings of council-maintained schools and academies.
Click here for fft educationdatalab article on Ofsted ratings of council-maintained schools and academies [August 2023]
Both Guardian articles quote research for the Local Government association which in both cases concludes that Ofsted ratings have on average been higher for Local Authority Maintained Schools than for Academies, but these conclusions have been called into question by research from FFT educationdatalab and in a recent Schools Week Fact Check. These 3 articles taken together suggest that it would be unwise to draw unequivocal conclusions as to the relative ratings of Academies and Local Authority Maintained Schools
While it is crucial to remember that comparisons of Ofsted Ratings and examination results must be used with great care, we can also consider 2023 examination statistics published by Ofqual.
Click here for recent data 2018-19- 2023/4 GCSE Results from the DfE
These data illustrate that hat, as expected, examination results in Local Authority Maintained Schools are better than those in Sponsored Academies but worse than those in Converter Academies.
Click here for Ofqual graphics on GCSE results 2018 -2024 in England by centre type and Click here for Ofqual Graphics on GCE Advanced Level results 2018-2024 by centre type.
In summary the data show that:
- At GCSE Level 7/A and above differences in results between Free Schools, Academies and Secondary comprehensive or middle schools are very small although Free School results are slightly higher. Notice that data are provided for all academies but that no separate data are provided for Sponsored and Converter Academies.
- At GCSE Level 4/C and above differences in results are negligible.
- At GCE Advanced Level A and above Free School results and Academy results are better than Secondary comprehensive or middle school results.
- At GCE Advanced Level C and above Free School results, Academy results and Secondary comprehensive or middle school results are very similar.
In my view we can infer little about the relative effectiveness of Free Schools, Academies and Local Authority Maintained Secondary comprehensive or middle school results since we have no information on the prior attainments of the pupils at these schools, but it does seem difficult to claim that the Academies and Free Schools programmes have had a major impact on educational attainment, Very similar conclusions are drawn by Sam Freedman in his study “Failed State” 2024 where he states that “While we have no gold standard studies, schools that didn’t become academies perform roughly as well. There is as much variation between academy trusts as there was between local authorities when they controlled all schools.” while in a recent article in The Conversation, Professor Stephen Gorard concludes that “. My research has found that academy schools are no better at raising attainment than the schools they replaced.”
Click here for House of Lords Library Paper Academy Schools: Government plans for change. [January 2025]
Part Five: Free Schools
Free Schools
What’s the difference between a free school and an academy? In law, free schools operate as academies. However, free schools are entirely new state schools, whereas most academies are either converters or sponsored academies, and will have previously been maintained schools.” Further official information on Free Schools may be found here
The Government's decision to fund the setting up or Free Schools can be seen as an important aspect of its general support for the operation of a quasi-market in education. Thus, it is argued that in localities where parents or teachers or other groups believe that the local authority schools are unsatisfactory, they will now be permitted to set up Fee Schools and that increased competition between the new Free Schools and existing local authority schools will drive up overall educational standards as has occurred, according to the Government, in Sweden where such a system is in operation. Furthermore, the UK Government claim that the introduction of Free Schools will increase equality of educational opportunity for disadvantaged pupils currently being taught in under-performing local authority schools. [However, some critics argue that the UK Government's interpretation of the Swedish experience with Free Schools is not entirely accurate.]
The number of Free Schools has increased under successive Conservative Government 2015-2024, but they still represent only a small proportion of all English Schools.
Click here for information as of May 2025 which indicates that at that time 741 Free Schools were open which represented 3.4% of English State Schools
As stated above the UK Government's case in favour of Free Schools is essentially that the operation of the quasi market will drive up average educational standards and that disadvantaged pupils will benefit from this, but several criticisms of Free Schools were quickly raised when the programme began.
- It is claimed that they will be set up disproportionately in affluent neighbourhoods and that they may attract "better" teachers from local authority schools. However, a technical study conducted in 2015 [see below] suggested that Free Schools were more likely to be set up in deprived areas but less likely to recruit disadvantaged pupils than were other schools in deprived areas. Consequently “there are no great differences between the social composition of secondary free schools and that of the national average. However, at primary school level there is some evidence that free schools are enrolling children with above average ability. Moreover, there are very substantive differences between the ethnic composition of free schools and other schools.”
- They may be set up in areas where local authority schools are already undersubscribed thus wasting resources.
- They may attract the better performing pupils from local authority schools thereby undermining them
- The combined effects of points 1-3 may be that they lead gradually to the development of a two-tier education system.
- There is a danger that although Free School Education Providers are not currently allowed to make a profit this condition could be relaxed in the future leading to the indirect privatisation of parts of the education system.
- Free Schools do not need to employ qualified teachers [which to some extent negates the second part of point above.]
- They may give too much freedom to faith-based schools or fundamentalist agendas although the UK Government point out that safeguards ensure that such schools must teach a broad and balanced curriculum and that creationism must not be taught as a valid scientific theory
Click here for a 2010 BBC item for and against free schools which provides further very useful information relating to the above 7 points.
Click here for an analysis of Free Schools [ BBC 2015]
Click here for Government Statements in support of Free Schools from 2015
Click here for a House of Lords item on Free Schools from 2019
Detailed Reports on Free Schools
Significant reports on Free Schools were provided by the Education Policy Institute [EPI] in 2019 and by the National Foundation for Educational Research [NFER] in 2021. More recent Ofqual and DfE examination data are also provided later in these notes.
The number of free schools has increased significantly since 2010. Click here for information as of May 2025 which indicates that at that time 741 Free Schools were open which represented 3.4% of English State Schools
Several detailed reports on Free Schools have been published in recent years by the EPI [Education Policy Institute in 2017 and 2019 and by the NFER in 2017 and 2021. Here I shall abstract some of the key points from the EPI Report of 2019 and the NFER Report of 2021.
Click here for EPI Report 2019 and here for a Prospect article in which the Executive Director and Head of Research at the EPI summarises the conclusions of the EPI Report.
Key Findings of the EPI 2019 Report {Students could also look at the concise Key Findings section of the Report.]
- Free Primary School places increased more in areas of high demand than in areas of low demand, but the reverse was the case with Free Secondary schools,
- Supporters of free schools claimed that they would be more likely to be opened in areas where current school quality was low, but EPI findings indicate the Secondary free school places were significantly more likely to be provided in areas of high school quality than of low school quality, New Primary free school places were slightly more likely to be provided in area of low school quality than in areas of high school quality.
- “At both primary and secondary, free schools are successfully targeting economically disadvantaged areas in England. However, at primary level, free school intakes are still more affluent than expected for their local areas. Secondary free schools, by contrast, do have intakes that are generally reflective of their communities.
- The EPI report draws an important distinction between economic disadvantage and educational; disadvantage and concludes that free schools are particularly likely to recruit pupils who are economically disadvantaged but not educationally disadvantaged.
- “Other disadvantaged areas, however, remain largely overlooked by the free schools programme. Pupils from ‘hampered neighbourhoods’ and ‘challenged white communities’ are considerably underserved. These are areas where education standards have been historically very low”. Note that this conclusion was highlighted in media coverage of the EPI Report. For example, click here for Schools Week coverage of the EPI Report.
- A small but growing minority of pupils with special educational needs and disabilities (SEND) attend special free schools nationally (less than 1%).The number of special free schools is however set to double in the coming years.”
Bearing in mind points 4 and 5 it is clearly difficult to estimate the impact of free schools on the attainments of pupils eligible for free school meals. It might be shown that pupils eligible for free school meals in free schools achieve better examination results than in other schools, but this may be because of differing characteristics of free school meal eligible pupils in free schools in comparison with other schools. It is well known for example that white British pupils eligible for free school meals are less likely to achieve good examination results than are free school meal- eligible pupils in other ethnic groups. This point is emphasised here in a Prospect article in which the Executive Director and Head of Research at the EPI summarises the conclusions of the EPI Report.
Click here for more recent data a indicating that differences in GCSE Results for all pupils differ only slightly as between different types of schools but results for Free School Meal Eligible pupils are considerably better in Free Schools than in other types of schools. However, as suggested above, this may be because the characteristics of free school meal eligible pupils in free schools may differ from the characteristics of free school meal eligible pupils in other types of school.
Click here to Download the NFER Report 2021. The short Executive Summary provides some useful information.
This NFER Report indicates that Free Schools are more likely than other state schools to be rated as Outstanding by OFSTED. I have illustrated this by extracting data from the most recent available OFSTED interactive graphic .
However the OFSTED Inspections regime is not without its critics as is discussed in Section TWO Part 9 of this document and you may also Click here for an analysis of OFSTED Inspections from fft educationdatalab which indicates that schools with larger proportions of pupils eligible for free school meals are disproportionately likely to be judged as requiring improvement or as inadequate by OFSTED. Such criticisms are rejected by spokespersons for OFSTED.
OFSTED Ratings of All English State Schools and Different Types of English State Schools as at December 2021 [ Black=All Schools; Blue= Primary Schools; Red =Secondary Schools; Nursery Schools and PRUs not included]

The percentages in this table refer to the most recent judgements of all schools which OFSTED has inspected up to and including 2021. They do not refer only to OFSTED judgements made in 2021.
It may be that as OFSTED begin to inspect more schools which are currently judged outstanding, the overall percentage of schools judged outstanding may begin to fall if many schools currently judged outstanding are in future judged to have deteriorated.
- The NFER Report states that “Free school pupils were disproportionally likely to come from an ethnic background, have a first language other than English, and be based in London. Secondary free school pupils were also significantly more likely to be from a disadvantaged background, although this is largely because free schools are in regions with higher levels of disadvantage. Free school pupils were also more likely to move from another school than other pupils, particularly during primary school.” [The 2021 NFER Report does not seem to draw the distinction between economic disadvantage and educational disadvantage which is made in the 2019 EPI Report, and this means that it is difficult to assess with certainty the impact of the Fee Schools Programme on the prospects of economically disadvantaged pupils.]
- Although Primary Free Schools were more likely than other state primary schools to be judged outstanding, Key Stage 2 results in Free primary schools were worse than in other state schools. Also “the progress made by pupils in LA maintained schools and converter academies was marginally higher than the national average in math but similar for reading and writing. In general pupils in free schools made the least progress across all individual subjects “. [ For further information Click here and scroll to page 6 of this DfE publication]. Of course, OFSTED does not base its judgements solely on examination results and rightly so but the relatively disappointing KS 2 results of Free Schools are a cause for concern.
- In 2019 at Key Stage 4 Free school pupils obtained marginally better GCSE results than pupils in other State Secondary schools. For detailed statistics click here and then on National Tables and here on Table 2. Table 2 is fairly complex in that it distinguishes between the several different types of state secondary school although there are no separate data for Grammar Schools. By comparison with pupils in all maintained secondary schools, free school pupils had a higher Attainment 8 score [48.2 v 47.4]; free school pupils were more likely to pass GCSE Maths and English with grades 9-4 [67.1% v 65.7%]; a larger percentage of free school pupils passed all EBacc components with grades 9-4 [ 22.5 % v 17.4%] although this was partly because a larger % of free school pupils actually entered all EBacc subjects]; and free schools had a higher Progress 8 score [0.21 v 0.01.]
- It is also necessary to assess the extent to which these better free school results arise because of differences in the pupil characteristics as between free schools and other state schools The Report from the Education Policy Institute [2019] concluded that some but not all of positive difference in examination results could be explained by differences in pupil intakes while a report from the NFER [2021 ] concluded that “Free school pupils achieved the equivalent of a tenth of a grade higher in each subject at KS4 (during Years 7 to 11 inclusive) compared to their peers in other schools, once pupil and school-level characteristics were controlled for. Disadvantaged free school pupils also outperformed their peers in other schools, but this difference may have occurred by chance.” This final sentence indicates that it certainly would not be fair to argue that on current evidence the introduction of free schools has significantly improved the prospects of pupils eligible for free school meals
- Regarding results for 16–19-year-olds the 2021 NFER Report concluded that “Free school performance at KS5 differed between 16-19 free schools, which provide sixth form education only, and secondary and all through free schools that have a sixth form. Pupils attending 16-19 free schools outperformed pupils in other schools. However, sixth form pupils in secondary and all-through free schools performed worse than their counterparts in other schools.”
My own conclusion, for what it is worth, is that although free schools are indeed more likely than other state schools to be judged outstanding by OFSTED, Key stage 2 results in 2019 were worse in free schools than in other state schools. KS4 results are slightly higher in free schools than in other state secondary schools and it is claimed in 2 significant recent reports that not all of this difference in results can be explained by differences in pupil intake as between free schools and other state secondary schools. Free school provision at KS 5 level is variable; Free 16-19 schools perform relatively well but 6th form provision in all -through secondary free schools is below par. There is little evidence that free schools significantly improve the prospects of pupils on free school meals. .
Click here for an item on Michaela community school [Guardian 2019]
Click here for a recent critical assessment of the Free Schools Programme [Fiona Millar Guardian 2021]
Click here for ongoing coverage of Free Schools from The Guardian
Click here for information on a new UCL project to be conducted over the next two years. I shall be returning to this! New links added 2025 Click here for a detailed paper from the Institute of Education- Faculty of Education and Society [2024]. Click here For Guardian report of Institute of Education paper [2024]
In the White Paper of 2022, it was announced the 55 local authorities with weak educational attainment levels would be designated Education Investment Areas and offered extra investment to improve educational attainment and that when the Opportunity Area ended in September 2022, the original 12 Opportunity Areas along with 12 further local authorities would be designated Priority Education Investment Areas within the new 55 Education Investment Areas.
You may Click here for a recent Guardian article which summarises the ways in which the Government hopes to improve educational attainment in Education Investment area and Education Priority areas and note that as part of their education strategy The Government intends to priorities Investment Areas for 15 new Free Schools including three new specialist [and selective] Sixth Form Free Schools.
Click here for the recent announcement [August 2023] that the Government has accepted plans for the building of 15 new Free Schools in these areas including 3 selective sixth form colleges. You may also click here for BBC coverage and here for a Guardian article critical of selective sixth form education.
In the Government announcement It is emphasised that “Free schools outperformed other types of non-selective state schools in England in last week’s A level results. Around 35% of A levels taken by pupils in free schools achieved a grade A or A* compared to 22% studied by pupils in local authority schools” and also that “Free schools bring high standards, more choice for parents and strong links to industry – and all in the areas where those opportunities are needed most.”
The first of these statements is certainly true but it is necessary to consider recent examination results in a little more detail.
Further Information on GCSE and GCE Advanced Level Results of Pupils attending Free Schools
Click here for information as of May 2025 which indicates that at that time 741 Free Schools were open which represented 3.4% of English State Schools
GCSE Results by Centre Type
You may click here and follow the GCSE link for Ofqual data comparing GCSE results in differing types of schools. Unfortunately the above link to results by centre type may be slow and, if so, you may try this alternative link.
These data indicate that Free School candidates accumulated more Grade 7 and above results and more Grade 4 and above results than candidates from LA Maintained Mainstream Secondary schools. However, the differences in attainment were in both cases very small.
You may Click here for KS 4 202324 and here for extracted data on attainments of FSM and FSM all other pupils in Free schools, Converter academies, Sponsored academies and LA maintained mainstream schools.
The term “FSM all other” refers to pupils not eligible for free schools and pupils who may be eligible for free school meals but have not claimed them.
Comparing Free Schools with LA maintained mainstream schools for FSM all other pupils and for FSM pupils indicates that in both cases these pupils in Free schools narrowly outperformed those in LA maintained mainstream schools in terms of Average Attainment 8 score and in terms of percentages of pupils achieving Grades 4 or higher and Grades 5 or higher in English and Mathematics GCSEs.
FSM all other pupils in free schools and FSM eligible pupils in free schools outperformed FSM all other pupils and FSM eligible pupils in LA maintained mainstream schools significantly in terms of EBacc achievement, but this can be explained partly by the fact that EBacc entry rates are much higher in Free Schools
However, as has been suggested in more detailed analyses, in the cases of FSM all other pupils and pupils eligible for Free School meals it may be that differences in achievement are explicable partly by differences in intakes, and so even though we have quite detailed statistics they cannot be used to assess unequivocally the relative effectiveness of different types of schools.
Also, might it be unwise to recommend the expansion of the Free Schools programme based on the perceived performance of the relatively small number of Free Schools which currently exist?
GCE Advanced Level Results by Centre Type
You may click here and follow the A Level link for Ofqual data comparing GCSE results in differing types of schools. The above link may be slow and if so, you may try this alternative link
These data indicate that Free school candidates accumulated significantly more Grade A and above results than candidates from LA maintained mainstream schools. However, the differences in GCE Advanced Level results attainment in terms of Grade C results by Centre Type was very small.
Click here for A Level and other 16-18 results 2023/2024 and here for extracted data on Attainment and other performance measures-by institution type and gender in 2023/2024 These data indicate that there were significant differences in GCE Advanced Level results as between of Free Schools and Free Schools 16-19. I return to this point below.
An item from the Education Hub of the DfE emphasised the effectiveness of Free Schools as follows.
How are free schools improving access to quality education?
“There are over 650 free schools in England with more than 350,000 pupils. They provide parents with more choice and offer high standards of education.
Secondary free schools are among the highest performing state-funded schools in the country. Primary, secondary and 16-19 free schools all out-perform the national average in Good or Outstanding Ofsted ratings.
In this year’s A level results, free schools outperformed other types of non-selective state schools. Around 35 per cent of A levels taken by pupils in free schools achieved a grade A or A* compared to 22 per cent studied by pupils in local authority schools.
That is why we are opening fifteen more free schools in areas with the lowest educational outcomes – creating more school places where there is the greatest need. This means more children will have access to a great education in their local area.”
However, in relation to the superior A Level results of Free Schools as illustrated in the above quotation we should also note the following points.
Free Schools accounted for only 104 A Level centres which suggests that it may be dangerous to generalise from such a small sample.
The DfE data distinguish between the performances of 16-19 Free Schools and 11-19 Free Schools. The performance of 16-19 Free Schools is indeed superior to that of LA maintained mainstream schools but that of 11-19 free schools is very similar in terms of Average A level result but worse in terms of proportions of students gaining high grade A level passes by comparison with LA maintained mainstream schools.
Also, although Free Schools in general are not permitted to select by ability, this restriction does not apply to 16-19 Free Schools. Although all state schools impose some entry restrictions on access to A level courses. it may well be that 16-19 Free Schools are on average more selective in relation to A Level access than LA maintained mainstream schools which may well help to explain their superior A level results.
It was recognised early on that many of 16-19 Free Schools would be highly selective as is indicated here and for examples of highly selective 16-19 Free Schools Click here for Kings Maths School and here for the London Academy of Excellence Tottenham
Click here for an item on Sir Mufti Hamid Patel the Chief Executive of Star Academy Trust who began by taking over failing State Schools but is now also involved with the foundation in disadvantaged areas of specialised selective Sixth Form Free Schools in collaboration with Eton College.
Click here for BBC coverage and here for ITV coverage of the announcement of the Star Academy- Eton Sixth Form Free Schools
Click here [Schools week] and here [fft educationdatalab] and here [Feweek] and here [Guardian] for some critical assessments of selective Sixth Form Colleges.
Should the Government have made clear the differences in examination results of different types of Free schools and the extent to which some 16-19 Free schools are highly selective?
Further Reading
Click here for Free Schools fail to fulfil their original purpose [Sutton Trust 2018]
Click here for a detailed paper from the Institute of Education- Faculty of Education and Society [2024]
Click here For Guardian report of Institute of Education paper [2024]
Click here for the Guardian Free School Page