Part B: Other Social Influences on Voting Behaviour from 1945-2017
Part B: Other Social Influences on Voting Behaviour from 1945-2017
-
Age, Gender, Region , Religion, and Ethnicity . Part B has now been updated to include information on the General Elections of 2015 and 2017
-
Click here for Ipsos Mori Data on UK General Election 1974-2010 and on the General Elections of 2015 and 2017
-
Click here for YouGov data on the 2017 General Election. As you would expect the results of the IPSOS MORI and YouGov surveys are not identical but they are very similar
-
Note also that the Ipsos Mori and YouGov series also include information on correlations between newspaper readership, housing tenure and education on voting behaviour.
[In Part B I consider the effects of other social influences other than social class on voting behaviour in the era of party identification [1945-1970] but for convenience I have also included information on the more recent effects of these social influences. This information has been extracted from the IPSOS MORI documents on Social Influences on Voting Behaviour October-1974-2017 , from various Parliamentary Research Briefs , and from Ipsos Mori and BES research studies on ethnicity and voting behaviour.
Although we can agree with the already mentioned statement from P.G.J. Pulzer in Political Representation and Election (1967) that in relation to the period between 1945 and 1970 "Class is the basis of British party policies: all else is embellishment and detail", it is also necessary to investigate the effects of other social factors [ age, gender, region, religion and ethnicity] on voting behaviour in the period 1945-1970. In several cases we shall find important connections between these variables and the more significant variable social class variable and these interconnections provide further support for P.G.J. Pulzer's statement.
-
Age and Voting Behaviour [Data from IPSOS MORI]
Click here for Ipsos Mori Data on UK General Election 1974-2010 and on the General Elections of 2015 and 2017 for further information showing the combined effects of age and gender on voting behaviour.]
Click here for YouGov data on the 2017 General Election. As you would expect the results of the IPSOS MORI and YouGov surveys are not identical but they are very similar . The YouGov data for 2017 are presented particularly clearly. It may be that A Level students should be broadly aware of long term trends but should concentrate especially on the most recent General Election data which appear below.
Electoral data from 1945 -1970 suggested that older voters were more likely than younger voters to vote Conservative and less likely than younger voters to vote Labour. This was often explained by the notion that as individuals grow older they become more set in their ways, more wedded to traditional values and attitudes and more likely to believe that Conservative governments are more likely to safeguard their financial and personal security which appear increasingly important in later life. However Butler and Stokes [and other psephologists] explained the relationship between age and voting behaviour in terms of the different processes of political socialisation affecting successive generations. Thus people born in say 1900 would have grown up before a powerful Labour Party existed and might as a result have been socialised to vote Conservative or Liberal rather than Labour. By comparison people born in say 1930 would have been reaching adulthood at the time of the reforming Labour Governments of 1945-51 and may have experienced processes of political socialisation which encouraged them to vote Labour in the 1950s and 1960s when they were still relatively young. and there was also the possibility that even in old age these voters might still be more likely to vote Labour than previous generations of older voters.
This line of thought leads on to further speculations. Would voters who grew to adulthood in the "swinging" radical 60s be especially likely to vote Labour when young and more likely than previous generations to continue to vote Labour even as they grew older? How would growing up in the era of Thatcherism affect voting behaviour in the future and so on?
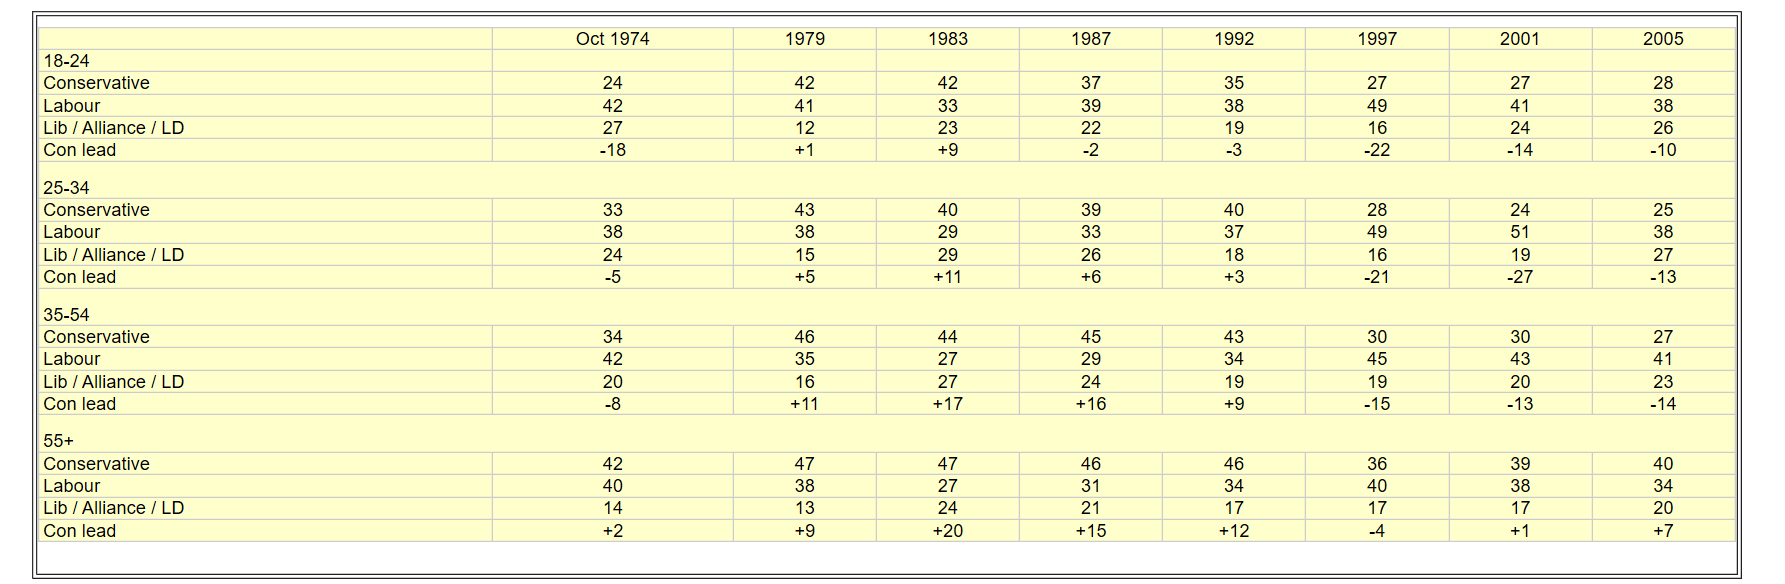
The following IPSOS MORI data illustrate relationships between age and voting behaviour between Oct. 1974 and 2005. The data do indeed show that broadly speaking older voters are less likely to vote Labour and more likely to vote Conservative than younger voters although there is not an absolutely perfect correlation between age and voting behaviour. particularly in the 2001 General Election.
-
In 2001 18-24 year olds were more pro-Conservative and less pro-Labour than 25-34 year olds although 35-54 year olds and voters 55+ were increasingly likely to vote Conservative and decreasingly likely to vote Labour.
-
In 2005 18-24 year olds were again more likely than 25-34 year olds to vote Conservative and but both age groups were equally likely to vote Labour. Again 35-54 year olds and voters 55+ were increasingly likely to vote Conservative and decreasingly likely to vote Labour.
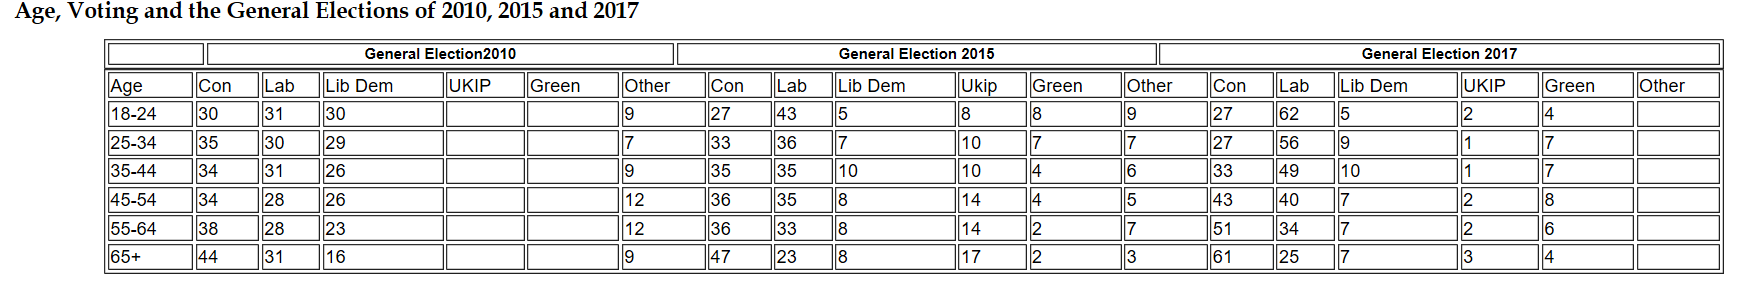
Age, Voting and the General Elections of 2010, 2015 and 2017
-
In 2010 18-24 year olds were marginally less likely to vote Conservative than to vote Labour. All other age groups [and especially voters 65+ were more likely to vote Tory than Labour.
-
In 2015 !8-24 year olds were now significantly more likely to vote Labour rather than Conservative and 25-34 year olds slightly more likely to vote Labour than Conservative. Voters 65 + were significantly more likely to votr Conservative than Labour and were also the age group most likely to support UKIP.
-
In 2017 support for Labour again increased significantly among 18-24 year olds, quite significantly among 25-34 and35-44 year olds to some extent among 45-54 year olds and 55-64 year olds However 45-54 year olds and 55-64 year olds were still more likely to vote Conservative as were especially voters 65+.
| Age and Voting Behaviour: Further Studies. Advanced Level students need not follow up all of these links . Take advice from your teachers.
Click here for a very useful, recent [December 2014] Opinium/Observer survey of young people's political views and voting intentions. highly recommended link added December 2014 Click here for a recent Guardian article by Matthew Goodwin "Far Right ideas: Britain's Generation Gap" Click here for a BBC Radio 4 programme on young people's political views [June 2014] Click here for a document from LSEGE2015 on the relationships between age and voting behaviour. The analysis suggests that voters do indeed become more pro-Conservative as they age and that the generational impact on voting behaviour is less important. A very significant conclusion. February 2015 However the following analyses from IPSOS Mori did suggest that the generational impact may be rather larger. This remains a difficult statistical question .Click here for detailed recent [June 2013] analysis form Ipsos Mori of relationships between Age and Voting behaviour It is important to note [see above link] that recent research published on the LSE General Election Blog suggests that individuals do indeed adopt more pro-Conservative views age they grow older and that the generational model suggests by Butler and Stokes [among others] may be less important than has previously been believed . However earlier [2013] findings [see above link] from Ipsos Mori do suggest that the generational model is rather more significant. Clearly this a very difficult statistical issue.
|
-
Gender and Voting Behaviour
Are women more or less likely than men to vote Tory? Are women more or less likely than men to vote Labour? How should we calculate the overall Gender Gap? How has the Gender Gap changed over time? Does the Gender Gap gap vary according to age and class?
Click here for YouGov data on the 2017 General Election and here for You Gov Data on the 2015 General Election. As you would expect the results of the IPSOS MORI and YouGov surveys are not identical but they are very similar . The YouGov data for2015 and 2017 are presented particularly clearly and students may wish to concentrate on these presentations.. It may be that A Level students should be broadly aware of long term trends but should concentrate especially on the most recent General Election data.
Click here for Ipsos Mori Data on UK General Election 1974-2010 and on the General Elections of 2015 and 2017
Click here for article on Gender and Voting Behaviour from LSE Blog By Dr Rosalind Shorrocks
Click here for a Guardian analysis by Peter Kellner of females' relatively pro-Labour sympathies [2013]
Click here for Guardian article on Gender and Voting [ 2013]
You may also Click here for BBC Analysis Programme [about 25 minutes] on Gender and Voting Behaviour.
Click here for a 2007 report of research on women's political attitudes which may help to explain the reversal of the traditional gender gap in voting behaviour
Some confusion may arise in the calculation of the gender gap because different psephologists make use of different definitions and calculations of the gender Gap' Thus :
-
The gender Gap may be calculated in two different ways; The Female- Male- Gender Gap in Conservative Voting and the Male -Female Gender gap in Conservative voting. These gaps have the same values but with different signs. This seems clear enough but by analogy if you imagine two individuals X and Y who weigh 15 stone and 11stone respectively the X-Y "weight gap" is 4 stone and the Y-X "weight gap" is -4stone. [In principle similar gender gaps in Labour voting could also be calculated]
-
The Female-Male Gender gap in Conservative Voting is calculated as [% Female Con Vote- % Female Lab Vote] minus [% Male Con Vote -% Male Lab Vote].
-
The Male-Female Gender Gap in Conservative Voting is Calculated as [% Male Con Vote- % Male Lab Vote] minus [% Female Con Vote- % Female Lab Vote].
I Overall Gender Gap Trends
The Full IPSOS MORI Data are presented below. Calculations of the Gender Gaps do not appear in the original tables and I have appended two additional rows containing calculations of the Female-male and Male-Female gender gaps. The following BLUE figures illustrate trends in the female -male gap in voting behaviour and the following RED figures illustrate trends in the male-female gap in voting behaviour . It is numerically inevitable that for each year the two types of gender gaps are identical but with different signs.
-
On the basis of the IPSOS MORI data [see below] the Female-Male Gender Gap changed from +12 to --3 between 1974[Oct] and 2017 illustrating that between these dates women became decreasingly pro-Conservative/increasingly pro-Labour by comparison with men.
-
Analogously the Male-Female Gender Gap changed from -12 to +3 indicating that between these dates men became increasingly pro-Conservative/ decreasingly pro-Labour by comparison with women.
-
The gender Gap figures in brackets for 2015 and 2017 are taken from the YouGov surveys of 2015 and 2017. They are similar but not identical to the Ipsos Mori results
-
There are also important interconnections between gender, age , social class , ethnicity and and voting behaviour. These interconnections will be considered below.
Overall Gender Gap Trends
The Full IPSOS MORI Data are presented below. Calculations of the Gender Gaps do not appear in the original tables and I have appended two additional rows containing calculations of the Female-male and Male-Female gender gaps. The following BLUE figures illustrate trends in the female -male gap in voting behaviour and the following RED figures illustrate trends in the male-female gap in voting behaviour . It is numerically inevitable that for each year the two types of gender gaps are identical but with different signs.
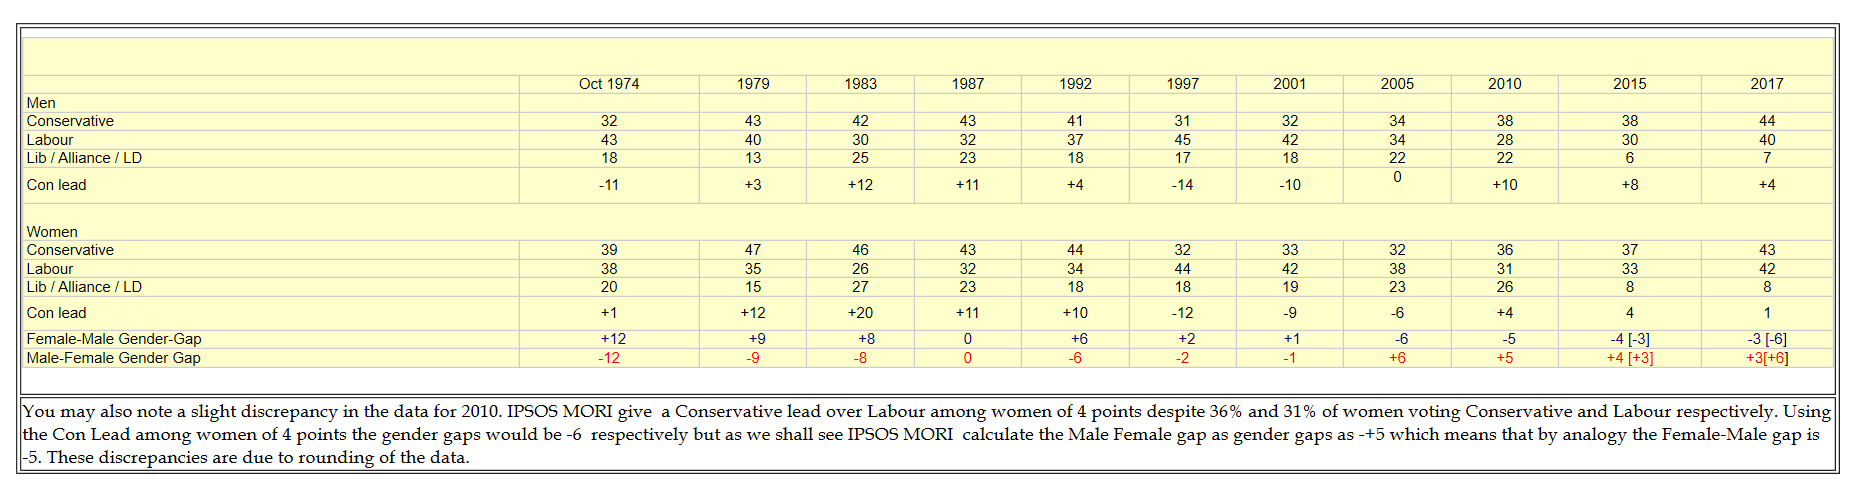
With regard to the data on the Female-Male Gender Gap we see that this has usually been positive from OCT 1974 to 2001 [although zero in 1987] and that it has been negative from 2005 to 2017. Thus the initially positive Female-Male Gender Gap is a measure of women's traditional relative Pro-Conservatism/ anti-Labourism and the more recent negative Female -Male Gender Gap illustrates Females recent relative Pro-Labourism/anti-Conservatism.
Analogously the Male-Female Gender Gap trend from negative to positive illustrates a shift from relative Male anti-Conservatism/Pro-Labourism to relative Male pro-Conservatism/anti-Labourism
.
| A Caveat?In 2018 there were some pollw which suggested that the traditional Female pro-Conservatism had reasserted itself . For example in some YouGov surveys at the time of the 2010 General Election the overall traditional gender gap does reappear and also a research study cited in Britain at the Polls 2010 : Nicholas Allen and John Bartle {Editors] 2010 reaches the same conclusion but even if this was true both the YouGov and Ipsos Mori Polls suggest that this had reversed in 2015 and 2017f |
Relative female Pro-Conservative/Anti-Labour voting up to 2005 was usually explained by theories that for much of the C20th, women were less likely to be in paid employment and less likely to be trade union members or because women were seen as possibly more "traditional" or more "deferential" than men in their views as a result gender differences in socialisation or because women, on average, live longer than men and as seen above, age is correlated with Conservative voting.
However according to the IPSOS MORI data females were relatively Anti-Conservative and Pro-Labour in from 2005 to 2017. This may have been due to long run generational changes in female attitudes and values and/or to the return to Parliament of an increasing number of female, Labour MPs and/or to Labour's greater willingness to campaign on female related issues although many women may have been dissuaded from voting Labour in 2005 as a result of UK involvement in the Iraq war . More recently some women may have been persuaded to switch away from the Conservatives and toward Labour because of their negative views of Coalition and Conservative Austerity policies.
Repeated Links: Worth following up
Click here For a Guardian analysis by Peter Kellner of females' relatively pro-Labour sympathies [2013]
Click here For Guardian article on Gender and Voting [ 2013]
You may also click here for BBC Analysis Programme [about 25 minutes] on Gender and Voting Behaviour.
Gender, Age, Social Class ,Ethnicity and Voting Behaviour.
. Gender gaps vary also as between young women and men and older women and men ,nd between working class women and men and middle class women and men and between men and women of different ethnicities .
Once again Click here for YouGov data on the 2017 General Election and here for You Gov Data on the 2015 General Elections.. The YouGov data for2015 present particularly clear data on relationships between gender, age and voting behaviour in 2015..
Click here for an article on Gender and Voting Behaviour in 2015 and 2017 for the BES by Jane Green and Chris Prosser
Once again Click here for Ipsos Mori Data on UK General Election 1974-2010 and on the General Elections of 2015 and 2017
Please note that I have made a change to this document on October 19th 2018. I originally calculated some different gender gaps related to age and class using the Ipsos Mori data and have reproduced these calculations below . However the BES data provide significantly different numbers and I have now included some of these data in RED . We must conclude that there are variations in voting patterns according to gender and age but that estimates as to the size of these gaps do vary as between highly respected pollsters such as Ipsos Mori and the BES. I will try to provide some further clarification on this point as soon as I can
I have used the 2017 data to calculate a range of different gender gaps relating to age and social class.Remember that the the Female-Male Gender gap in Conservative Voting is calculated as [% Female Con Vote- % Female Lab Vote] minus [% Male Con Vote -% Male Lab Vote]
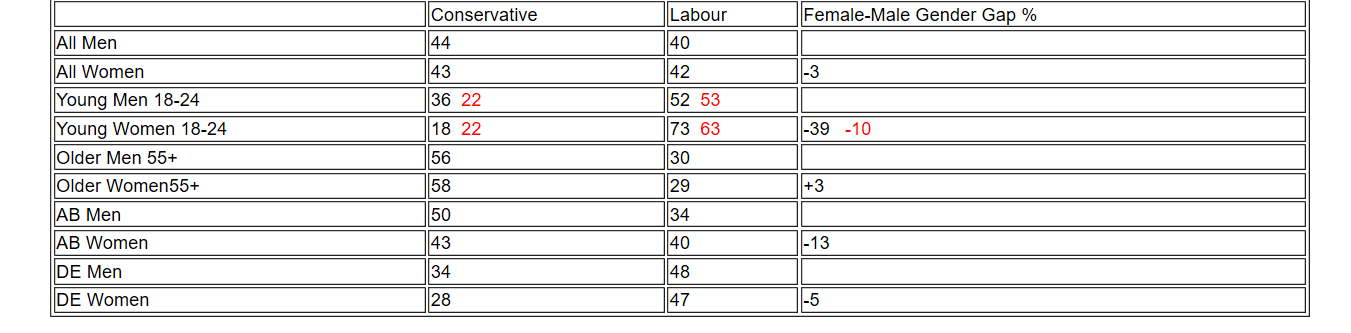
Using the above formula for the calculation of the Female-Male Gender Gap :
- The Overall Female- male Gender Gap is Minus 3% indicating that in 2017 females were narrowly pro Labour/anti Conservative compared with men. Notice that this occurred because although women were more pro-Conservative than pro-Labour , men were even more pro Conservative than pro-Labour.
- Young women were much more pro-Labour/ant-Conservative than were young men. Nevertheless both Young Men and young women were relatively pro-Labour and anti-Conservative
- Older women were narrowly more Pro-Conservative/anti-Labour than with older men although both groups were Pro-Conservative/anti-Labour
- AB women were relatively more anti Conservative/Pro-Labour than AB men although both groups were anti Labour/pro Conservative
- DE Women were relatively Anti Conservative/pro Labour compared with DE men although both groups were antiConservative/pro Labour
Gender, Class and Voting Behaviour in 2017
In the long term social class differences in voting behaviour have narrowed but in so far as they continue to exist we should expect working class women to be slightly more pro-Labour/anti-Conservative than middle class women.
Gender, Ethnicity and Voting Behaviour in 2017.
Ethnic minority members are more likely than white voters to be pro-Labour/Anti-Conservative. . Thus we should expect ethnic minority women to be more pro-Labour/anti-Conservative than white women. Relationships between ethnicity and voting behaviour will be considered below.
-
Region and Voting Behaviour
Click here for a recent Guardian article on cultural divisions within the UK.
Click here for the BBC's Map of the 2001 General Election Results
Click here for the BBC's Map of the 2005 General Election Results
Click here for the BBC's Map of the 2010 General Election Results
Click here for the BBC's Map of the 2015 General Election Results and here for the BBC's 2017 maps and charts
Click here for a Guardian article on Region and Voting Behaviour in January 2012
Click here for detailed data on the decline of the Two Party System linked to regional trends in support for Labour and Conservative Parties. This is a link to an article by Professor Tony Travers on the LSE Politics and Policy Blog. [Added December 2014 and very much worth reading.]
Voters in Scotland, Wales and the more northerly regions of Great Britain have traditionally more likely to vote Labour than Conservative partly because there have traditionally been larger percentages of working class voters in these areas and because in areas of high working class concentration the likelihood that working class voters will in fact vote Labour tends to be greater. It has been noted elsewhere that the linkages between social class and voting behaviour have tended to weaken especially since the 1960s but it has also been argued that there are good reasons to believe that this process of class dealignment may be stronger in the South of England than in Northern England, Scotland and Wales.
It is very important to note that support for Labour fell very significantly in Scotland in the 2015 General Election because Labour had opposed Scottish Independence in the referendum of 2014. Labour's share of the Scottish vote increased only slightly between 2015 and 2017
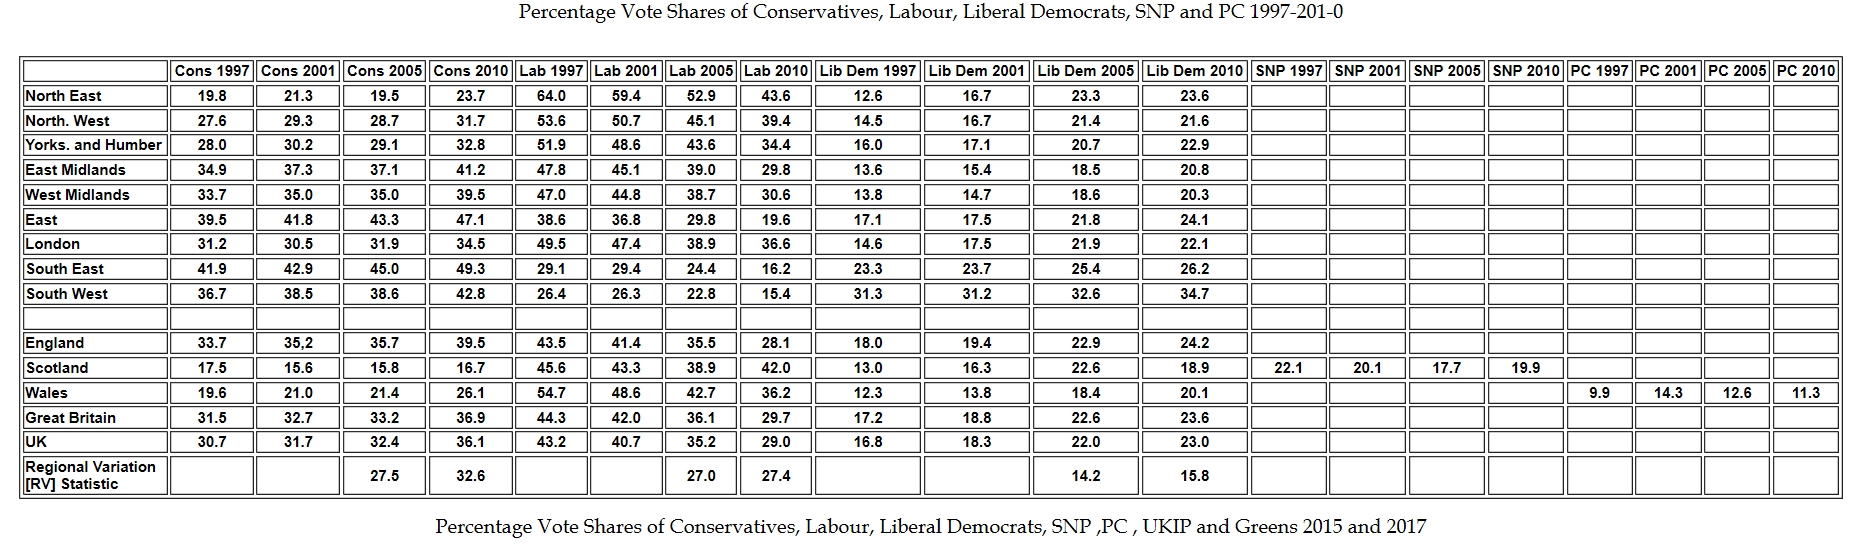
With regard to the General Elections of 1997, 2001 , 2005 and 2010 if we compare the General Election results of 1997 and 2010 we may note the following main regional trends. [Data follow on the General Election Results of 2015 and 2017]
- ]Notice that in each of the 4 General Elections English voters have been more pro-Conservative and less pro-Labour than Scottish and Welsh voters.
- However note that in both 1997 and 2001 English voters were nevertheless more likely to vote Labour than to vote Conservative. In 2005 and 2010 the reverse was the case.
- Labour's large 1997 leads over the Conservatives in the North East, the North West and Yorkshire and Humberside diminished substantially by 2010.
- The East Midlands and the West Midlands were pro-Labour in 1997 but pro-Conservative in 2010.
- London was strongly pro-Labour in 1997 but only narrowly pro-Labour in 2010.
- The Conservatives' 1997 lead over Labour in the East ,the South East and the South West increased considerably by 2010.
- Between 1997 and 2010 there was little overall change in Labour's lead over the Conservatives in Scotland.
- Support for Labour actually increased between 2005 and 2010: the only Country/region where this occurred. Reasons included Gordon Brown's Scottishness, the fact that the Liberal Democrats had discarded two Scottish leaders and the possibility that the SNP rather than the Labour Government received more blame for economic difficulties in Scotland. Notice also that David Cameron's strategy seemed to fall on many deaf ears in Scotland.
- Support for Labour in Wales declined very considerably between 1997 and 2010 and the Conservatives and Liberal Democrats gained approximately equally as a result of the decline in Labour's support .
- Liberal Democrat support in creased between 1997 in all of the English Regions and in Scotland and Wales . However interestingly, the increase in Liberal Democrat support was smallest in the South West which has traditionally been the area most strongly in support of the Liberal Democrats leading to speculation that Liberal Democrat support may have peaked , at least temporarily in the South West.
- The final row of the first table provides a measure of regional variation [RV] in voting behaviour in the general elections of 2005 and 2010. For each main political party the RV statistic shows the percentage difference in voter support between the most popular region and the least popular countries/regions. You may notice for example that the regional variation in support for the Lib Dems is lower than for the Conservative and Labour parties and that the RV increased for the Conservative Party increased by more than the RVs for Labour and Liberal Democrats.
Within the regions voters in conurbations and large cities have been generally more likely to vote Labour and less likely to vote Conservative than voters than voters living in small towns and rural areas and there are also additional factors relating to particular constituencies which may influence their voting patterns such that, for example constituencies with relatively high proportions of white collar workers and retired voters are relatively more Conservative while constituencies in deprived inner city areas are especially pro-Labour. [See Britain Votes 2005 edited by Pippa Norris and Christopher Wlezien for further details.]
These regional and local differences in voting behaviour have been explained primarily in terms of social class- related factors.
-
Regions and localities with relatively high concentrations of working class residents and relatively low concentrations of middle class residents are likely to generate more Labour voters simply because of the relatively large numbers of working class residents.
-
However in regions and localities of high working class concentration the strength of the political socialisation process encouraging working class voters to vote Labour is likely to be especially strong so that voting support for Labour is likely to be greater than might have been predicted from the proportions of working class and middle class residents alone and even middle class Labour voting is likely to increase in such areas.. Similar processes operate in regions and localities with high concentrations of middle class residents to increase middle class and also working class support for the Conservative Party.
-
.
The following data illustrate regional differences in voting behaviour between 1997 and 2010. They have been collated from successive House of Commons Library Research Papers on the General Elections of 1997, 2001, 2005 and 2010. {Notice that I have included the SNP and PC votes as percentages of the Scottish and Welsh votes respectively but have not included the SNP and PC votes as percentages of the GB and UK votes; neither have I included data on votes for other UK parties nor on the vote shares of the Northern Irish parties. Interested students may consult the original sources for these data. ]
Percentage Vote Shares of Conservatives, Labour, Liberal Democrats, SNP and PC 1997-201-0
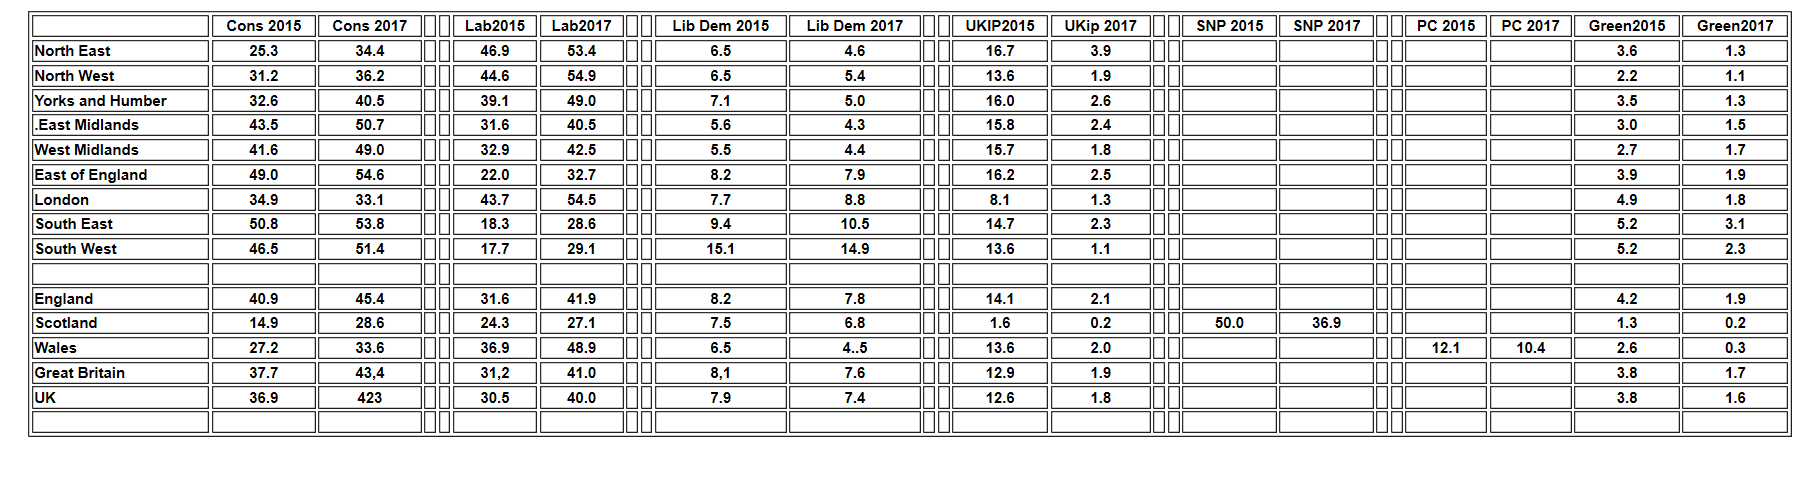
Click here for the BBC's Map of the 2015 General Election Results and here for the BBC's 2017 maps and charts.
Click here and scroll to page 5 for House of Commons Research Briefing Map of the 2015 General Election
Click here for the House of Commons Research Briefing on the 2017 General Election
It is very important to note that support for Labour fell very significantly in Scotland in the 2015 General Election because Labour had opposed Scottish Independence in the referendum of 2014. Labour's share of the Scottish vote increased only slightly between 2015 and 2017 while the Conservative share of the Scottish vote increased more quickly so that by 2017 the Conservatives were marginally more popular than Labour in Scotlandand
The traditional English regional patterns were observable in the 2015 General Election. Labour were more popular than the Conservatives in the North East, the North West, Yorkshire and Humberside and London while the Conservatives were more popular than Labour in the East Midlands, The West Midlands, the East of England, the South East and the South West.
The Liberal Democrat vote declined significantly throughout the UK although its vote was higher in the South West than all other English regions as has traditionally been the case.
Overall UK support for UKIP rose from 3. 1%in 2010 to 12.6% in 2015 and relatively high levels of support for UKIP were found in all English regions although UKIP support in London and especially in Scotland was lower than in the rest of the UK.
Overall UK support for the Greens stood at 3.8% in 2015 and Green support was rather lower in the North West and the East and West Midlands than elsewhere.
Overall UK support for the Conservative and Labour Parties increased considerably between 2015 and 2017 but the basic regional patterns of support were maintained. Labour more popular in the North, East, the North West, Yorkshire and Humberside and London and the Conservatives more popular than Labour elsewhere. Support for UKIP fell significantly in all regions ; support for the Greens fell in all regions and support for the Liberal democrats fell in all regions apart from London and the South East. Meanwhile support for the SNP fell considerably leading to a significant Conservative revival and a much smaller Labour revival.
 Religion and Voting Behaviour
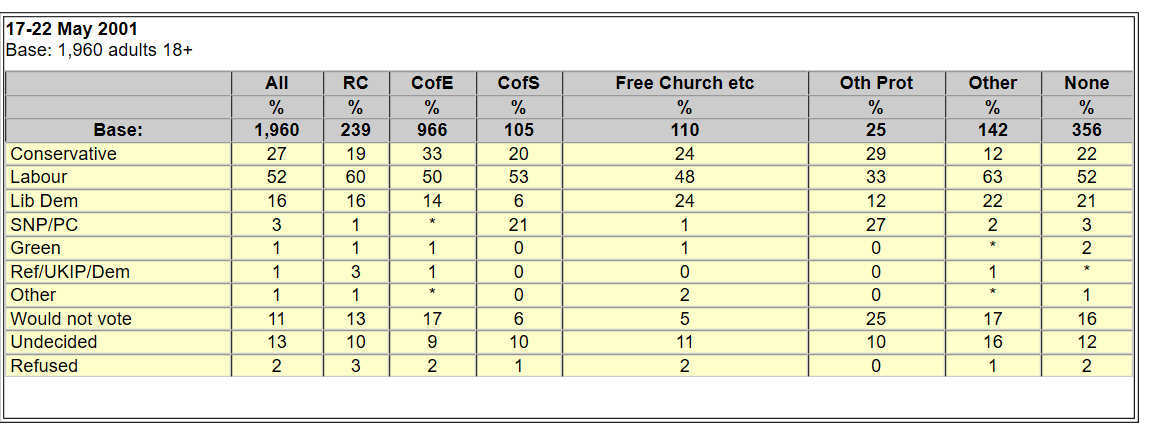
[Data from IPSOS MORI: results of their 2001 survey on religious affiliation and party support.]
Religion was a much more significant influence on voting behaviour in mainland Britain from the mid C19th until the early C20th when members of the Church of England were especially likely to support the Conservative Party and Catholics and Nonconformist churches were more likely to support the Liberal Party. It continues to have a very strong influence on voting behaviour in Ireland and also in certain key areas on mainland Britain such as Liverpool and Glasgow where Catholics have traditionally been out of sympathy with traditional Conservative governments' rejection of an independent united Ireland and Protestants have supported the Conservative defence of an independent and Protestant dominated Northern Ireland. Similar views can also be found in certain key areas on mainland Britain such as Liverpool and Glasgow where religious links with Ireland may override social class loyalties and cause many working class Protestants to vote Conservative and middle class Catholics to vote Labour..
However , as we have seen , it was argued that by the 1950s and 60s social class was now the most important determinant of voting behaviour and that other factors, including religion had become far less significant. Nevertheless Catholics have been quite significantly more likely to vote Labour and less likely to vote Conservative than supporters of he Church of England and other Protestant denominations mainly because mainland British Catholics may often have had family connections with Ireland but also because they were more likely than Protestants to be working class and it tended to be argued that so that their voting behaviour was actually explained more by their class membership than by their religion. The following data show continuing correlations between voting behaviour and religion in 2001 and some have argued that these correlations too are likely mainly to reflect the indirect influence of social class.
However you may click here for more recent research on relationships between religion and voting behaviour in which it is argued that religion does continue to exercise an important independent effect on voting behaviour. [December 2014]
It is important to note also that in the 2005 General Election there were greater than average declines in support for the Labour Party in constituencies with large Muslim communities because of Muslim opposition to the Iraq War which may however have derived from a complex combination of religious and ethnic influences. Labour lost Bethnal Green and Bow to the Respect candidate George Galloway [who had consistently opposed the Iraq War] partly as a result of the defection of Muslim voters.
Click here For BBC coverage of a 2014 report on Religion and voting behaviour and here for data on religion and voting behaviour in the UK General Election of 2017 and here for some discussion of religion and voting behaviour in 2019 and here for a detailed discussion of trends 2014-2019
"Race", Ethnicity and Voting Behaviour
Click here for a detailed analysis of Ethnicity and Voting Behaviour in 2015
Click here and here and here for information on Ethnicity and voting behaviour in 2015 from the Runnymede Trust. [3 Part article]
Click here for BBC item on ethnicity and voting behaviour in 2018 by Prof. Rosie Allen. The article has further links including one to Radio 4 Analysis programme on ethnicity and voting behaviour.
Sociology students will be familiar with the important distinction between "race" [which is a biologically based concept of negligible scientific validity] and the much more useful concept of ethnicity which refers to the cultural, religious and linguistic aspects of different social groups' lives. I focus here on relationships between ethnicity and voting behaviour.
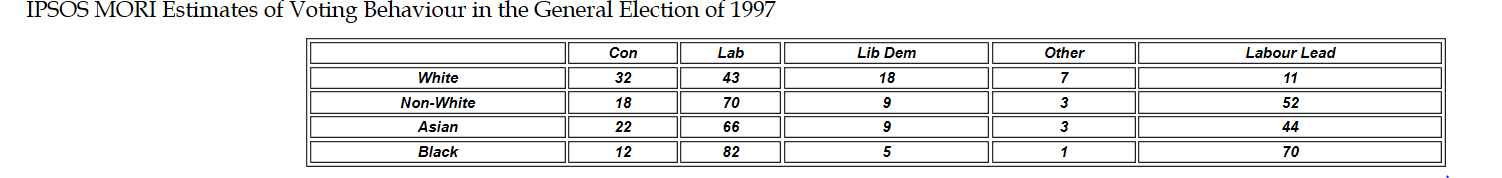
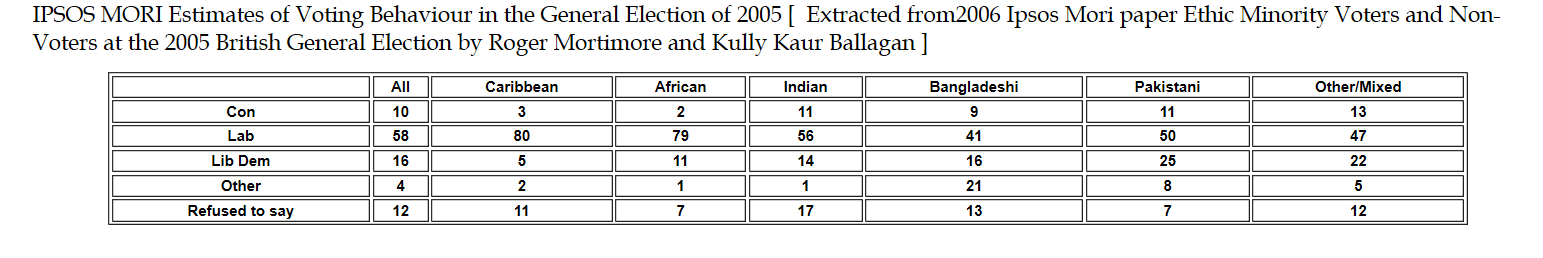
As is shown above ethnic minority voters [both Asian and Black] were far more likely than White voters to vote Labour and far less likely to vote Conservative in the General election of 1997. This, of course, should come as no surprise since although ethnic minority members can be found throughout the British class structure Afro-Caribbean origin and Bangladeshi and Pakistani origin people are represented disproportionately in the working class, disproportionately likely to experience poverty and also disproportionately likely to live in large conurbations where working class support for Labour is strongest. The discrepancy between Black and Asian voting can be explained at least to some extent by the more privileged situation of Indian voters relative to other ethnic minority voters.
Nevertheless in overall terms ethnic minority members in all social classes are more likely than white voters in the same social classes to vote Labour which suggests that ethnicity has an important independent effect on voting behaviour beyond what would be predicted solely by the consideration of the class situations of ethnic minority voters. Ethnic minority voters may tend to believe that even if significant patterns of ethnic disadvantage continue to exist in UK society, Labour governments have at least addressed these problems more meaningfully than have Conservative governments which, if anything are associated with the hardening of ethnic inequalities especially in the era of Thatcherism. Furthermore although ethnic minorities are heavily underrepresented among MPs in all political parties it has traditionally seemed more likely that their representation would increase faster in the Labour Party .
| The following information on the 2005 General Election would have been very important for students sitting A Level examinations around 2005 but it will be more useful for current students to concentrate on data and analysis relating to more recent General Elections which does appear later in this document. This study may perhaps be disregarded now.
The above data on the 1997 and 2005 General Elections are not fully comparable since the 1997 data are drawn from Ipsos Mori's national survey classifying ethnic minority members into the broad Black and Asian categories while the 2005 data are drawn from a small weighted sample of 1220 ethnic minority voters who are classified into differing ethnic groups within the broader Black and Asian categories. In the 2005 sample the percentages of Caribbean and African voters voting Labour were only slightly smaller than the percentage of Black voters voting Labour in the 1997 sample whereas the percentages of Indian, Bangladeshi and Pakistani voters voting Labour in the 2005 sample were considerably smaller than the percentage of Asian voters voting Labour in 1997. Support for the Conservative Party was slightly higher among all three categories of Asian voters in the 2005 sample than for Asian voters as a whole in the 1997 sample but support for the Liberal Democrats [which opposed the Iraq War] among all three categories of Asian voters was significantly higher in the 2005 sample than in the 1997 sample. Bangladeshi and Pakistani voters were significantly more likely than Indian voters in the 2005 sample to support Other parties[ mainly the Respect Party which also opposed the Iraq War] but it is noticeable also that in the 2005 sample whereas Bangladeshis were more likely to vote for Other parties than for the Liberal Democrats the reverse was the case among Pakistanis. Although Labour did face significant electoral difficulties in 2005 as a result of the defection from Labour of many Muslim voters as a response to the Iraq war and to legislation relating to asylum seekers and anti-terrorism Labour only lost one parliamentary seat [Bethnal Green and Bow] as a result of such defections, in this case mainly to the Respect Party. In the 2005 General Election Respect fielded 26 candidates and approximately 25% of its total national votes were gained by George Galloway in Bethnal Green and Bow which, according to the 2001 Census has 35.7% of Bangladeshi residents but only 2.7% of other Asian residents and also, at 40%, has the highest concentration of Muslim residents of all constituencies in the UK. Ultimately in the 2005 General Election 13 Labour ethnic minority MPs were elected compared with two Conservative ethnic minority MPS and no Liberal Democrat ethnic minority MPs . [I am grateful to Mr. A. Endersby of Bishop Wordsworth's School Salisbury for drawing my attention to the Ipsos Mori report on the 2005 General Election ]
|
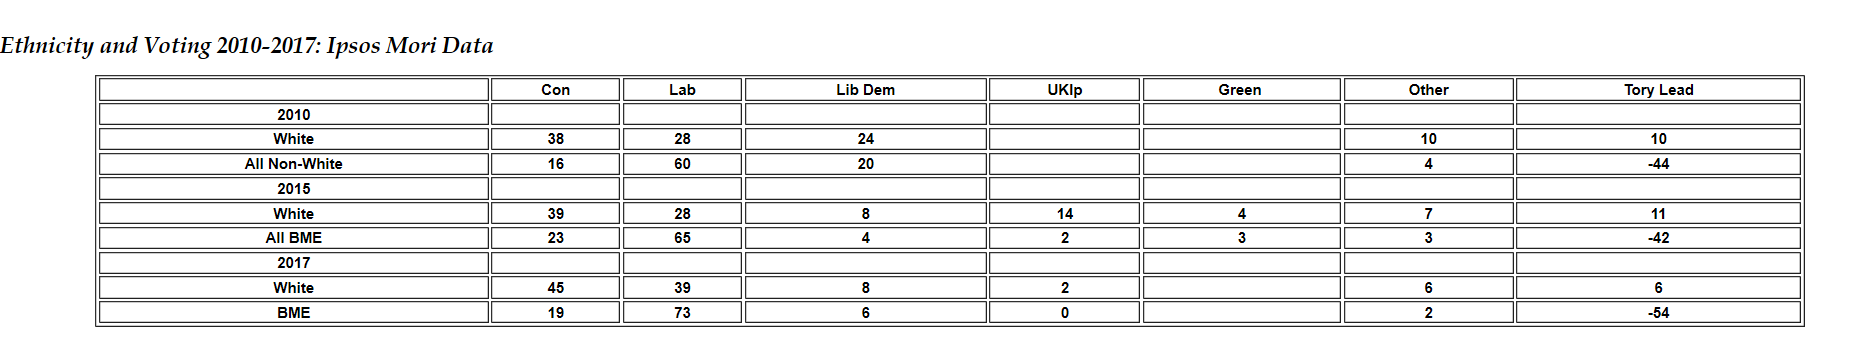
Although these data do not refer to different ethnic groups within the BME category they do indicate that between 2015 and 2017 BME support for the Tories fell while BME support for Labour increased
Click here for Guardian article on the diversity of ethnic voting in 2015
Click here and then on the link to the relevant presentation for information on the diversity of ethnic voting in 2015 the var
Click here and here and here for information on Ethnicity and voting behaviour in 2015 from the Runnymede Trust. [3 Part article]
Click here Mind the Gap: a detailed report on Ethnicity and the 2017 General Election from British Future
Click here for BBC item on ethnicity and voting behaviour in 2018 by Prof. Rosie Allen. The article has further links including one to Radio 4 Analysis programme on ethnicity and voting behaviour. Very useful******
| There are additional fairly recent items on ethnicity and voting behaviour here but I think that it will not be necessary for Advanced Level students to follow up these links. Take advice from you teachers on this! |
When he became leader of the Conservative Party David Cameron stated that he hoped to promote the election of more Conservative BME MPs and this may have encouraged greater electoral support among BME voters [especially perhaps among Indian voters] for the Conservatives. In the event in 2010 27 BME MPs were elected to Parliament: 16 Labour MPs , 11 Conservative MPs and zero Liberal Democrats. and so Mr. Cameron can claim to have made some progress in this respect. Nevertheless members of BME groups are still under-represented in Parliament: at the time of the 2001 Census BME members constituted 7.9% of the UK population but only 4.2% of MPs after the 2010 General Election. Labour regained Bethnal Green and Bow from Respect in the 2010 General Election.
It has been argued that gradual changes in the UK class structure resulting in the increased representation of ethnic minority members within the UK middle class could be expected to lead to increased support for the Conservative party especially perhaps among Indian -origin and some -African origin voters. However you may Click here for a Runnymede Trust/BES article on Ethnic Minority Voting in the 2010 General Election which suggests that even though there has been some decline in Minority Ethnic support for Labour Minority Ethnic voters remained considerably more likely to vote Labour than to vote Conservative in 2010.. You may also click here for further recent survey data on ethnicity and voting behaviour in 2005 and 2010 . [Data from the Ethnic Minority British Election Survey {EMBES} as reported on the British Religion in Numbers {BRIN} website.
Click here for a recent BBC Audio Report [about 9 minutes] on Ethnicity and Voting Behaviour [from The Westminster Hour]
Click here for further recent survey data on ethnicity and voting behaviour in 2005 and 2010 . [Data from the Ethnic Minority British Election Survey {EMBES} as reported on the British Religion in Numbers {BRIN} website.]
Click here for a recent [December 2012] Independent article reporting Conservative concerns at their current unpopularity among ethnic minority voters
Click here for Lord Ashcroft's Publication [April 2012] on Ethnicity and Voting Behaviour. Lord Ashcroft is a former Deputy Chairman of the Conservative Party who has been involved heavily in the finance and organisation of previous Conservative Party election campaigns. The publication provides very detailed information on ethnic patterns of voting behaviour with the aim of devising new strategies for increasing the attractiveness of the Conservative Party to ethnic minority voters.
Click here for a BBC item on The Conservatives and Ethnic Minority Voters February 2013
Click here for a Guardian item on Ethnic Minority Voters and the 2015 General Election but also here for an important Guardian letter from Dr. Chris Husbands August 2013
Click here for an Observer item on ethnicity and voting behaviour. August 2014
Click here for a detailed analysis of Ethnicity and Voting Behaviour in 2015
Document Summary
-
The years 1945-1970 may be described reasonably as a time of two party dominance and relative electoral stability.
-
Psephologists explained voting behaviour mainly in terms of the Party identification model of voting behaviour in which for most voters social class differences result in differences in political socialisation, social class differences in party images, social class differences in party identification and social class differences in voting behaviour.
-
Throughout 1945 -1970 there were fairly stable relationships between social class and voting behaviour when , on average approximately 62% of working class voters voted Labour and approximately 66% of middle class voters voted Conservative. {Percentages are own calculations from data in How Britain Votes].
-
Substantial minorities of voters did not vote predictably in accordance with their social class. They came to be described as "deviant voters" and several factors were suggested as explanations of their voting behaviour.
-
Although social class was the most important determinant of voting behaviour age, gender, region, religion and ethnicity also influenced voting behaviour although in some cases social class also helped to explain the influences of these non-class factors on voting behaviour.
The relatively stable patterns of voting behaviour which existed from 1945-1970 were increasingly replaced by increasing electoral volatility leading to new theories of voting behaviour focusing on the decline of party identification [or partisan dealignment] and class dealignment . These developments will be discussed in the following document.
Appendix
In this Appendix I have saved extracts from an earlier version of this document for my own purposes . The information in this Appendix is not required in A Level Specifications and A Level students can confidently disregard it.
| Some Further Information on The Butler and Stokes Study. [A LeveL students could disregard this section |
-
Butler and Stokes used a modified version of this schema in which they subdivided the C1 grouping into "skilled or supervisory non -manual" and "lower non -manual categories" because they particularly wished to investigate the possibility of significant variation sin party identification within the broad C1 category. In some later studies much more attention would be given to the definition and measurement of social class, as we shall see in the following document.
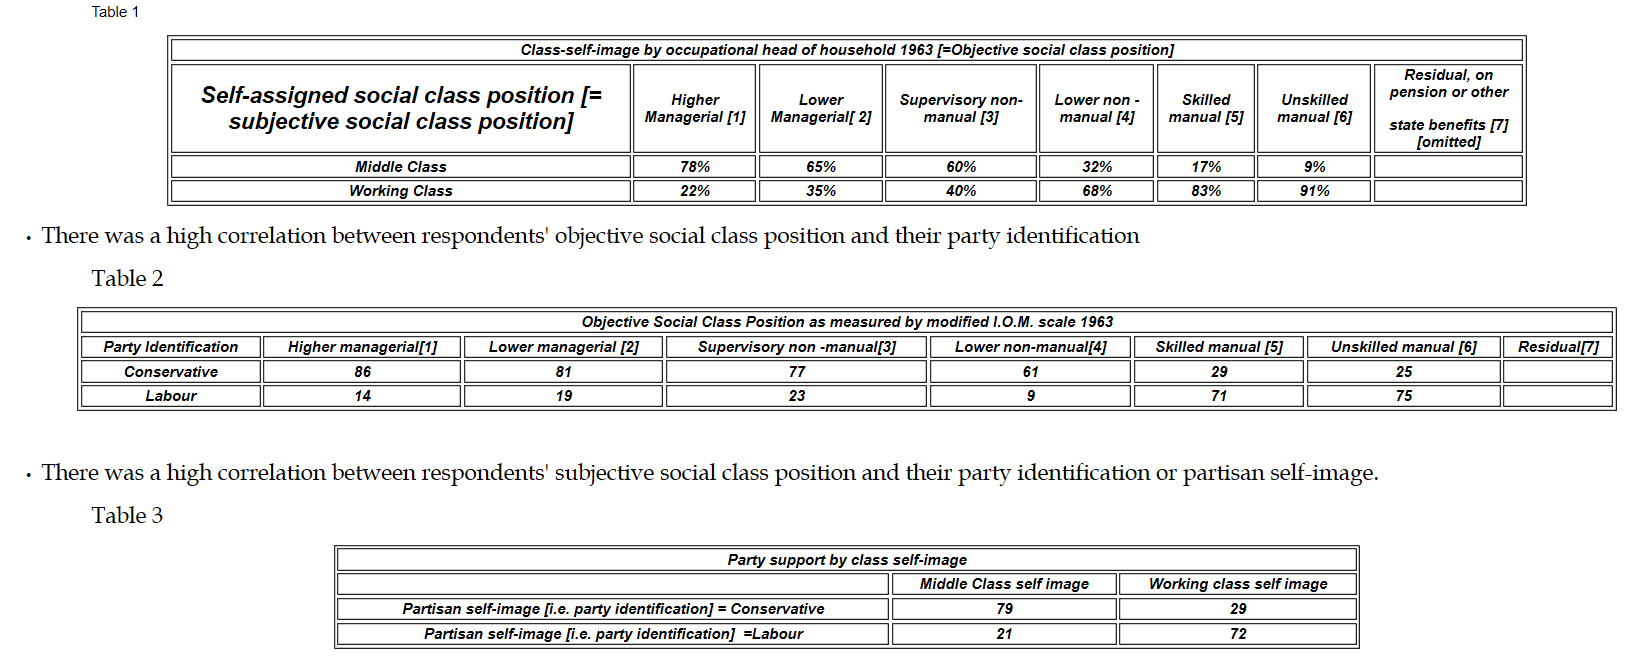
The following first three tables have been slightly adapted from Political Change in Britain .
-
When the respondents self assigned social class position[ their subjective social class position] was compared to their social class position as measured by Butler and Stokes' modified I.O.M. scale [their objective social class position] it was found that subjective and objective social class positions were strongly but far from perfectly correlated.
More Detailed Information on Trends in Gender Gaps Related to Age and Social Class to 2010. Advanced Level Students may disregard this material
However when they calculated gender gaps for different age groups they found that even though the overall Female -Male gender gap was positive in 1983, 1992 and 1997 and zero in 1987 indicating women's overall relative pro-Conservatism/anti -Labourism negative Female-Male gender gaps sometimes occurred among younger voters indicating that they were relatively anti Conservative/ pro-Labour in comparison with younger men. The following table provides information on the gender gap related to age.
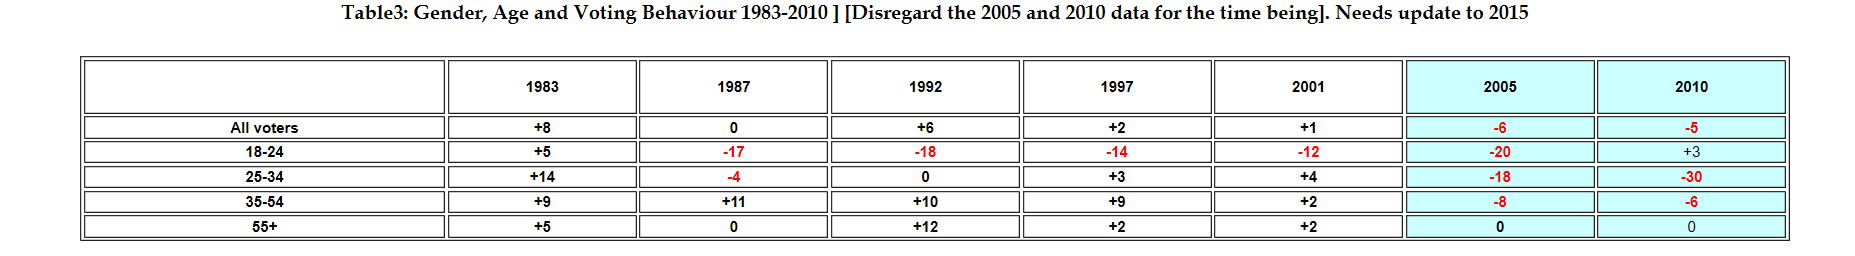
Thus although women in total tended to be more Pro Conservative/anti Labour than men in between 1983 and 2001 [as indicated by the positive Female-Male Gender gap for all voters other than in 1987] relative pro-Conservatism /anti-Labourism was usually greater among older women relative to older men than among younger women relative to younger men as indicated especially by the large negative female -male gender gaps for 18-24 year olds in 1987-2001 and the narrow gender gaps [negative, zero and only narrowly positive among 25-34 year olds.[ Data for 1983-2001 from Labour's Landslide 1997 and Explaining Labour's Second Landslide 2001 both by Robert Worcester and Robert Mortimore for IPS0S MORI. [The 2005 and 2010 calculations have been done by me and are based upon IPSOS MORI 2005 and 2010 original data.]
Gender, Age and Voting Behaviour in 2005 and 2010. Needs update to 2015 and 2015
We have seen in Table 2 above that IPSOS MORI began in 2005 to present their summary information on the Gender Gap in terms of the Male- Female Gender Gap and the same procedure is adopted by Rosie Campbell in her recent writing on voting behaviour. I shall therefore use this same procedure below Thus the Male -Female Gender Gap in Conservative voting is measured as:
[% Male Con Vote- % Male Lab Vote ] minus [% Female Con Vote- % Female Lab Vote] and a positive Male-Female Gender gap in 2005 and 2010 implies that men have become relatively pro-Conservative/anti-Labour by comparison with women.
Using IPSOS MORI data I have calculated the overall Male-Female gender gap and various Male-Female gender gaps for different age groups the 2005 and 2010 General Elections. You may use the following link to update the table for 2015 and 2017. Click here for Ipsos Mori Data on UK General Election 1974-2010 and on the General Elections of 2015 and 2017
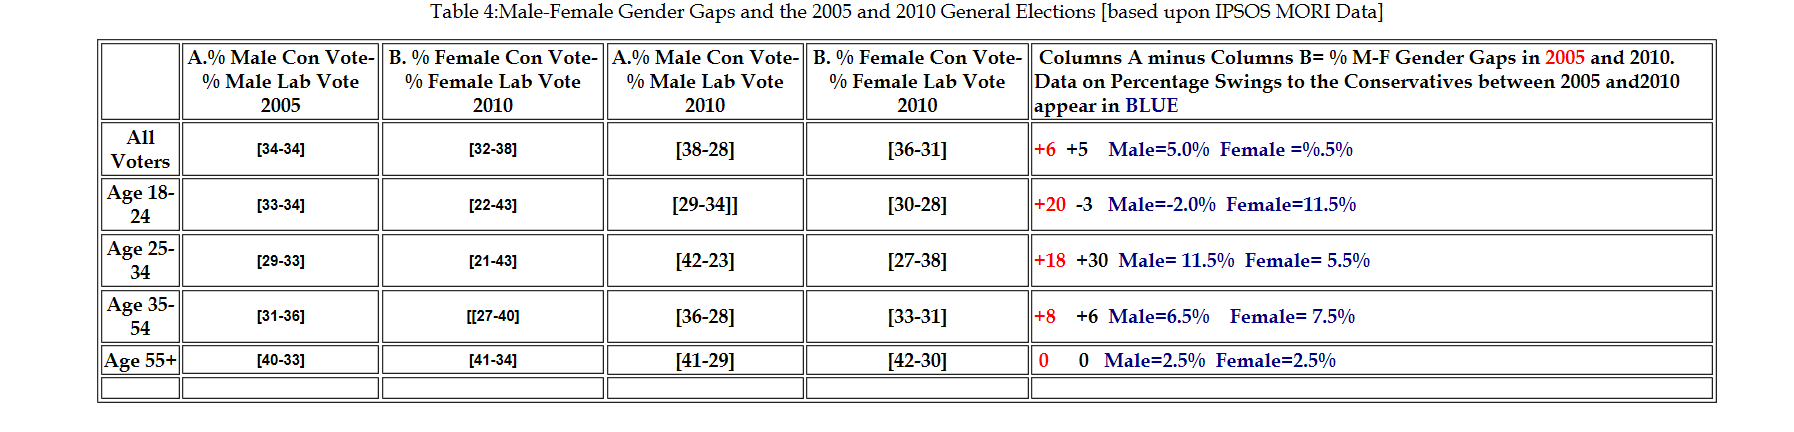
- By 2005 males as a whole had become relatively pro-Conservative/anti- Labour by comparison with females primarily as a result of the development of large positive Male-Female gender gap among 18-24 year olds and among 25-34 year olds.
- However by 2010 the situation among younger voters changed significantly.
- Among voters 18-24 young men swung slightly from Conservative to Labour between 2005 and 2010 whereas young women swung substantially toward the Conservatives to such an extent that males 18-24 were actually less pro-Conservative/anti-Labour than females 18-24 .in 2010.
- However among voters 25-34 males swung more toward the Conservatives than women 25-34 so that males were even more relatively pro--Conservative/anti-Labour relative to females in 2010 than they were in 2005.
- The large changes in different directions in the Gender gap among 18-24 year olds and 25-34 year olds more or less offset each other and this , combined with the much smaller changes among other age groups meant that there was very little change in the overall Male-Female gender gap between 2005 and 2010.combined .
Gender, Age, Social Class and Voting Behaviour in 2001 and 2010.
So far we have investigated the trends in the overall gender gap and the variations in the gender gap as between voters of differing age groups. In their study of the 2001 General Election Robert Worcester and Roger Mortimore presented information relationships between Gender, Age and Social Class. {See Explaining Labour's Second Landslide pp 201-2Robert Worcester and Roger Mortimore.] These data are presented in summary form as follows.
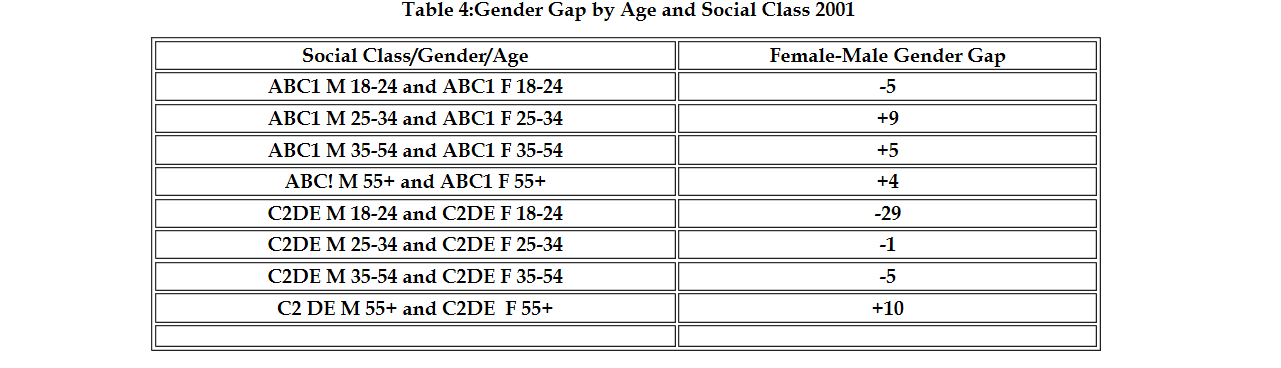
We may note the following main points
- Traditional Positive Female-Male Gender gaps existed among voters aged 55+ in both social classes
- Non -traditional negative gender gaps existed among voters aged 18-24 in both social classes. However the negative gender gap was far greater in the C2DE social class than in the ABC1 social class.
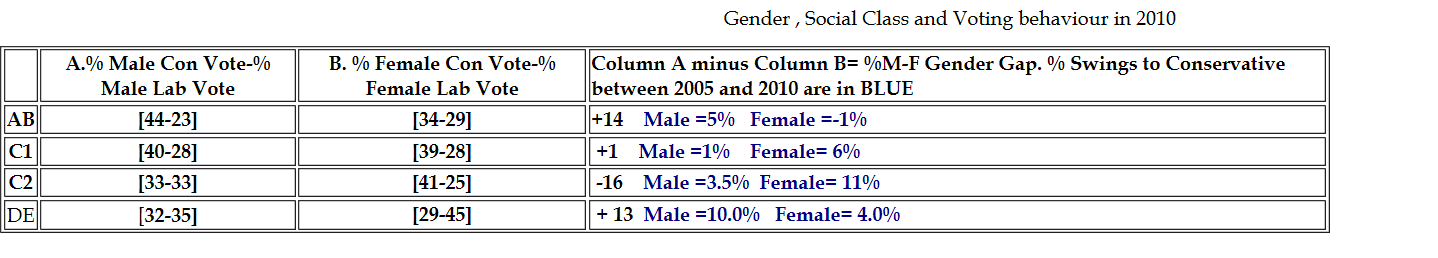
Some further information on gender, age and voting behaviour and gender. social class and voting behaviour in 2005 and 2010 is presented below..
-
AB Males are relatively Pro-Conservative and Anti-Labour compared with AB females. Notice that AB females actually swung from Conservative to Labour between 2005 and 2010. All other social class/gender groups swung to the Conservatives.
-
The gender gap is negligible among C1 voters.
-
C2 males are relatively anti-Conservative and pro-Labour compared with C2 Females. Notice that the C2 Male swing to Conservative was far smaller than the C2 Female swing to Conservative.
-
However DE males are relatively pro-Conservative and anti-labour compared with DE females. Notice that the DE Male swing to Conservative was far greater than the DE Female swing to Conservative.
-
How would you explain the significant differences in voting behaviour of C2 and DE women?
For return to EDUQAS Sociology: Politics Option - Click Here
For return to ALYR1-Elections, Electoral Systems and Voting Behaviour - Click Here