Voting Behaviour 1992-2019: Sources, Data and an Assignment
In the original version of this document I concentrated on the General Elections of 1992-2010 but students may now prefer to concentrate on the General Elections of 2010-2019. Therefore I have reorganised the document into 3 sections as indicated.
- Section 1: Voting Behaviour and Social Class 2010-2019
- Section 2: Some Useful Sources on the UK General Election of 2019
- Section 3: Voting Behaviour and Social Class 1992-2010.
Section 1 : Voting Behaviour and Social Class 2010-2019
-
Now let us look carefully at the 2019 General Election. Fill in the following brackets for the 2019 General Election.
-
Fill in the brackets AB % Conservative =[ ]; AB % Labour = [ ]; AB % Liberal Democrat = [ ]
-
Fill in the brackets C1 % Conservative = [ ] : C1% Labour = [ ]; C1 % Liberal Democrat = [ ]
-
Fill in the brackets C2 % Conservative = [ ] : C2% Labour = [ ]; C2 % Liberal Democrat = [ ]
-
What does this tell you so far about the extent of social class differences in voting behaviour in 2019?
-
Now fill in these brackets DE % Conservative [ ]; DE % Labour [ ]; DE % Liberal Democrat [ ]
Further Analysis
-
-
Social Class and Voting Behaviour 2010 and 2015: Analysis
Between 2010 and 2015 there was a slight increase in class voting.. An increased d percentage Both AB and C1 voted Conservative and a reduced percentage of AB voters voted Labour although there was a 1% increase in support for Labour among C1 voters. Also Among C2 and DE voters support for Labour increased and support for the Conservatives declined. However C2 voters were still just as likely to vote Conservative as to vote Labour.
The most noticeable trend was the decline in support for the Liberal Democrats in all social classes and the increased support for UKIP in all social classes. In percentage terms support for UKIP was particularly high among C2 and DE voters but since these social classes combined are now smaller than the AB and C1 social classes combined in numerical terms support for UKIp was higher in the AB and C1 social classes.
-
Social Class and Voting Behaviour 2015 and 2017: Analysis
In their summary of their statistical data Ipsos Mori combine the results of the ABC1 classes and C2DE classes and reach the following broad conclusion.
"The middle classes swung to Labour, while working classes swung to the Conservatives – each party achieving record scores. Although the Conservatives maintained a six-point lead among ABC1s, Labour increased its vote share among this group by 12 points since 2015. Similarly, while Labour had a four-point lead among C2DEs, and increased its vote share among this group, this was eclipsed by the 12-point increase for the Conservatives. This is simultaneously Labour’s best score among ABC1s going back to 1979, and the Conservatives’ best score among C2DEs since then"
-
Labour and Conservative improvements derived from the deterioration of support for UKIP ,the failure of Lib Dem support to recover and the slight decline in the Green vote in 2017 which IPSOS Mori did not register in their 2017 table and from the slight increase in turnout.
-
Between 2015 and 2017 both the Conservative Party and the Labour Party increased their share of the vote by 6% and 10% respectively mainly at the expense of UKIP whose vote declined by 11%. Both major parties also gained because of an overall increase in turnout and a switch of 2015 Green voters mainly to Labour.
-
Both the Labour Party and the Conservative Party increased their vote shares in all social classes.
-
In social classes AB and C1 the Labour Party increased its vote share by more than the Conservative Party
-
In social classes C2 and DE the Conservative Party increased its vote share by more than the Labour Party.
-
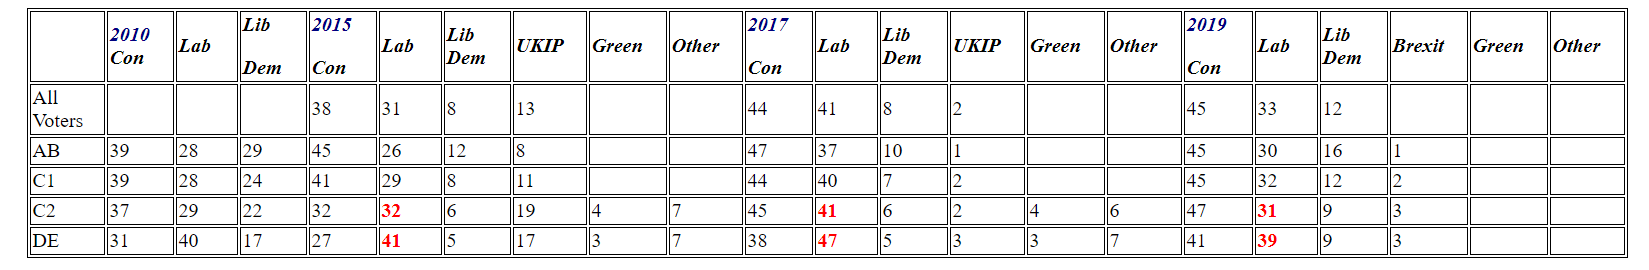
It is noticeable that whereas in 2015 C2 voters split equally between Conservative and Labour Parties at 32% in 2017 the C2 voters were more likely to vote Conservative [45% ] than Labour [41%] mainly because C2 voters who deserted UKIP were more likely to switch to the Conservative Party than to the Labour Party.
-
DE voters who had voted UKIP in 2015 were also more likely to switch to the Conservatives to Labour which meant that the Labour lead among DE voters narrowed slightly between 2015 and 2017
-
Although the Labour Party were doubtless pleased that they had increased their vote share among working class voters they may well have been disappointed that the Conservative vote share among working class voters had increased by a larger percentage.
Social Class and Voting Behaviour 2017 and 2019
-
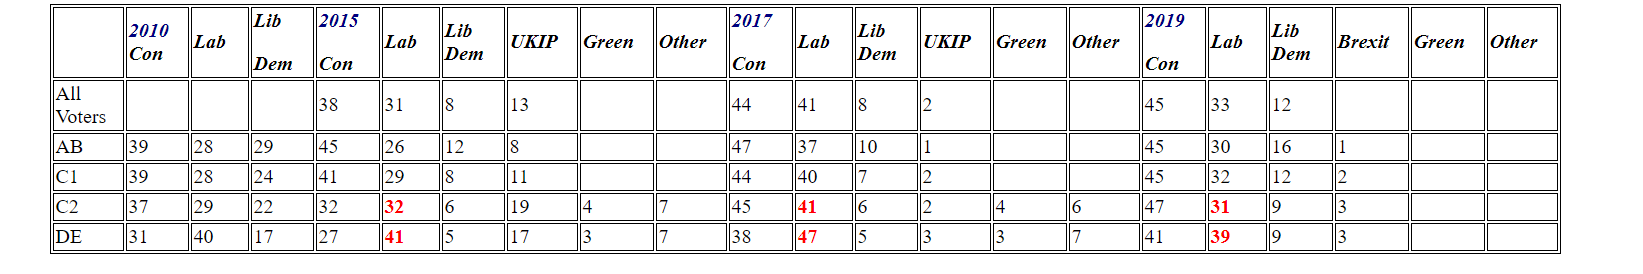
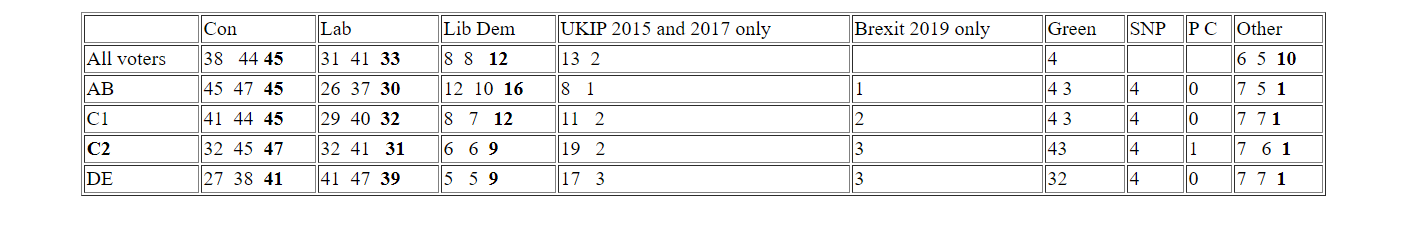
Support for the Conservative Party fell slightly among the AB classes but rose slightly among the C1, C2 And DE classes
-
Support for the Labour Party fell significantly among all social classes. Classes AB and C1 were significantly less likely to vote Labour than Conservative in 2019 but so too were C2 voters [47% Conservative and 31% Labour [ and even DE voters were more likely to vote Conservative than Labour [41% Conservative and 39% Labour].
-
This pattern of C2 voting behaviour in 2019 is highly significant but it should be noted that comparing the 2015, 2017 and 2019 General Elections what has happened is that C2 voters increased their support for the Conservatives very substantially in 2017 and indeed increased it further slightly again between 2017 and 2019 whereas although they had increased their support for Labour significantly significantly between 2015 and 2017 , in 2019 C2 support for Labour fell back to its 2015 level.
-
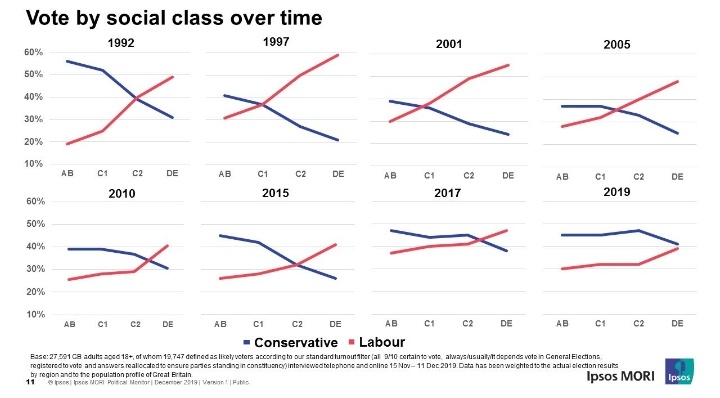
Clearly therefore it is necessary to look at the changing patterns of social class voting in longer term perspective rather than concentrating only on the changes between 2017 and 2019. In this respect this article by Peter Kellner [Prospect December 2019 and the following chart from the 2019 Ipsos Mori presentation may be useful
|
|
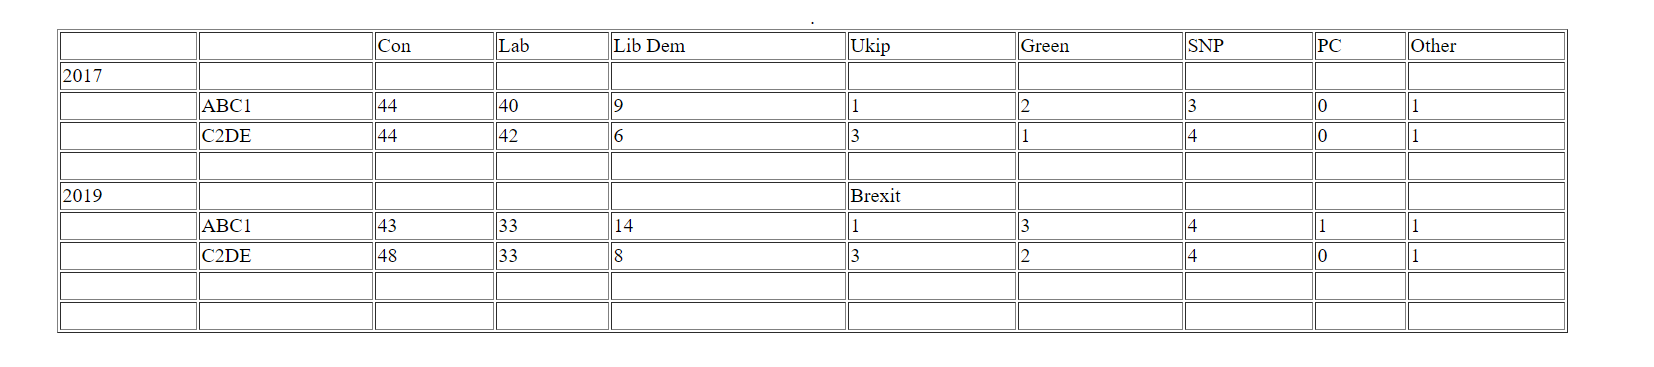
Additional useful information is provided in the You Gov 2017 and 2019 surveys which combine the AB and C1 social classes and the C2 and DE social classes and also provide information on social class support for the smaller political parties. [Some rows do not sum to 100% because of rounding]
.
Questions
-
What happened to working class support for Labour between 2015 and 2017 and between 2017 and 2019. How would you explain this?
-
Working class support for the Conservatives increased between 2015 and 2017 and between 2017 and 2019. Why?
-
What happened to AB support for Labour between 2015 and 2017 and between 2017 and 2019?Why
-
What happened to AB support for the Conservatives between 2015 and 2017 and between 2017 and 2019. Why?
-
What happened to overall Liberal Democrat support between 2015 and 2017 and between 2017 and 2019?
-
How would you describe trends in the relationships between social class and voring behaviour between 2015 and 2017 and between 2017 and 2019?
-
What does all this tell you about the issue of Class Dealignment?
Section 2 : Some Sources on the UK General Election of 2019I have asterisked the most useful statistical sources
Click here for BBC data on results for the UK, England Scotland, Wales and Northern Ireland and here for 2019 results ****^
Click here for Sir John Curtice assessment for the BBC. Also do follow the links to his other articles for BBC in which he considers the importance of political issues in general and of Brexit in particular and trends in the relationship between social class and voting behaviour*****
Click here for How Britain voted in 2019 [You Gov]*****
Click here for How Britain voted in 2019 [Ipsos Mori] and
for Ipsos Mori Slide presentation*****
Click here for Prof. Matthew Goodwin Why Labour lost the election
Click here for a critical assessment of BBC Election Special coverage
Click here for Why Labour lost from Stats for Lefties
Click here for a critical assessment of what's in store
Click here for You Gov on why Labour voters [2017] deserted Labour in 2019
Click here for article suggesting that the British working class is not socially conservative
Click here for a 2017 House of Commons Library Briefing Paper and here for a 2019 House of Commons Library Briefing Paper.
Click here for Guardian results table 2019 and here for full Guardian coverage
Click here for Loughborough University and mass media coverage and here for article from the Conversation on Media coverage
Click here for How Britain voted in 2019 [You Gov]
Click here for coverage from The Conversation
Click here for How Divided is Britain
Click here for a critical assessment of Corbyn and Corbynism by Andrew Rawnsley [Obviously not an assessment that Mr Corbyn's supporters would accept]
Click here for David Graeber
Click here for Low Income Voters. the 2019 General Election and the future of British politics.
Click here for What happened to Britain's Labour Party?
Students may now choose to disregard the following section...or not!
Section 3: Voting Patterns 1992-2010
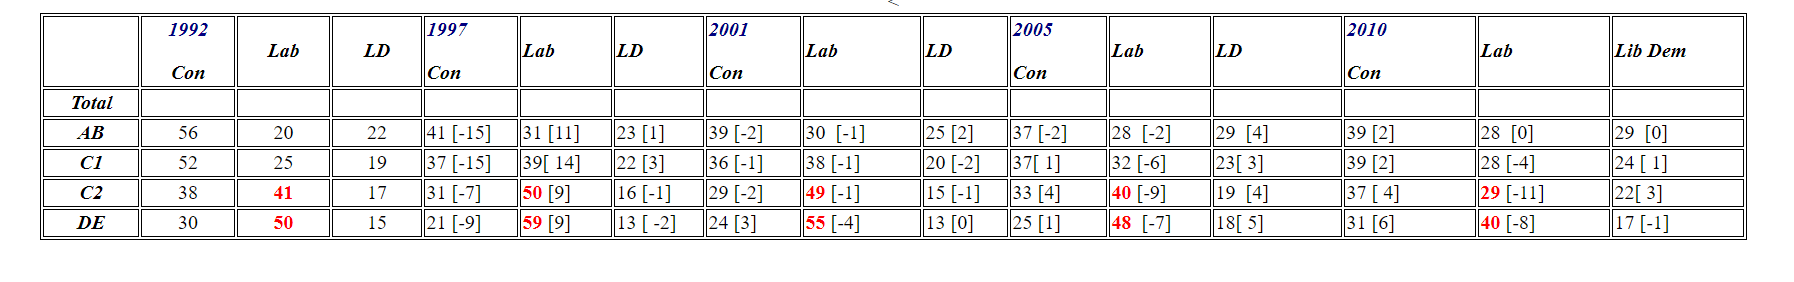
- The General Elections of 1992 -2010 [IPSOS MORI data] Changes since previous General Election appear in brackets
I have also reorganised the data in a slightly different format.
In 2019 1% af ABC1 voters and 3% of C2/DE voters voted fot the Brexit Party
-
The 1992 General Election: See Column Two .The high points of class voting were in the General Elections of 1950 and 1951 since when a process of class dealignment has occurred. Nevertheless there are still significant relationships between social class and voting behaviour in the 1992 General Election. Middle class voters are considerably more likely than working class voters to vote Conservative and working class voters are considerably more likely than middle class voters to vote Labour. However there is also substantial non-class voting. Support for the Liberal Democrats varies little along class lines middle class voters are slightly more likely than working class voters to vote Liberal Democrat..
-
The 1997 General Election: See Column Three. In 1997 voters in all social classes switched substantially from Conservative to Labour. Notice however that the percentage switches were greater in the middle class than in the working class thus suggesting further class dealignment between 1992 and 1997.
-
The 2001 General Election: See Column Four. There was a substantial decline in turnout between 1997 and 2001 but Labour again won a substantial victory. The pattern of class voting was very similar to 1997 and the percentage changes in each cell for the 2001 General Election are usually small although there is quite a substantial switch from Labour to Conservative voting among DE voters.
-
The 2005 General Election : See Column 5 In 2005 there is a slight switch in AB support away from both Conservative and Labour to the Liberal Democrats. However much more significant is the switch of C1, C2 and DE voters away from Labour and partly to the Conservatives and partly to the Liberal Democrats.
-
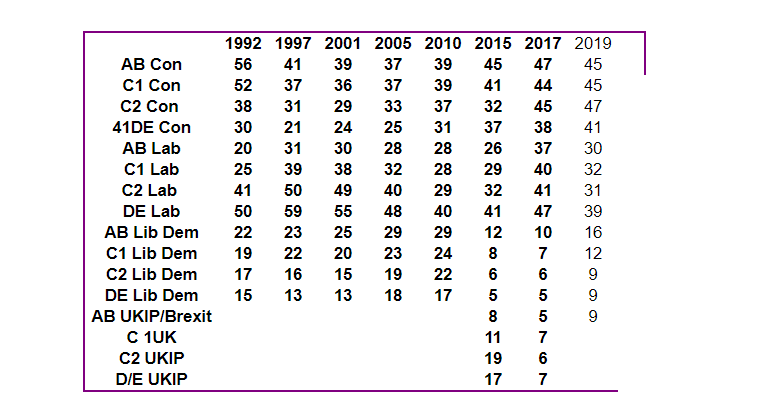
The 2010 General Election See Column 6 AB and C1 support for the Conservatives increases but C2 and DE support for the Conservatives increases by more. AB support for Labour is unchanged , C1 support for Labour falls by 4% but C2 and DE support for Labour falls by 11% and 8% respectively. In terms of class voting the 2010 General Election is highly significant because patterns of voting behaviour among AB, C1 and C2 voters are virtually identical or, putting it another way , social class differences in voting behaviour between AB, C1 and C2 voters have virtually disappeared. Only Social Class DE is significantly less likely than the other social classes to vote Conservative and significantly more likely than the other social classes to vote Labour and even for the DE support for Labour is considerably smaller and support for the Conservatives considerably greater than in previous General Elections.
-
All of these points are illustrated in these EXCEL diagrams Here you will find three sheets of numerical data and their related EXCEL Charts. Sheet One/Chart One presents the data on Social Class and Voting Behaviour relating to all three major political parties while Sheet Two/Chart Two focuses only on the Conservative and Labour Parties and Sheet Three/Chart Three focuses only on the Liberal Democrats. The diagrams may help to clarify the overall statistical patterns
-
Questions
-
Explain the term "Partisan Dealignment".
-
Explain the term "Class Dealignment"
-
Use the data in the second column of the second table above to show that there were considerable social class differences in voting behaviour in 1992.
-
Between 1992 and 1997 a substantial percentage of voters in all social classes switched from voting Conservative to voting Labour. Give three reasons why this may have occurred.
-
Briefly compare patterns of social class voting in 1997 and 2010. Was there much change?
Now let us look carefully at the 2010 General Election. Fill in the following brackets for the 2010 General Election.
-
Fill in the brackets AB % Conservative =[ ]; AB % Labour = [ ]; AB % Liberal Democrat = [ ]
-
Fill in the brackets C1 % Conservative = [ ] : C1% Labour = [ ]; C1 % Liberal Democrat = [ ]
-
Fill in the brackets C2 % Conservative = [ ] : C2% Labour = [ ]; C2 % Liberal Democrat = [ ]
-
Very importantly what does this tell you so far about the extent of social class differences in voting behaviour in 2010?
-
Now fill in these brackets DE % Conservative [ ]; DE % Labour [ ]; DE % Liberal Democrat [ ]
-
Would you accept the general conclusions that social class differences in voting behaviour as between social classes AB, C1 and C2 were negligible in 2010 ; that only the DE grouping was noticeably more pro- Labour and less pro-Conservative than the three other social classes; and that even among the DE grouping their support for Labour was significantly lower than it has been in the past?
These data show a significant decline in social class voting between 2005 and 2010 primarily because Labour has lost support among the working class while retaining much of its support among the AB section of the middle class. Also the Conservatives have gained support primarily from the working class while their middle class support has remained relatively static.
Some Further Optional Questions
From your answers to questions 6-13 would you conclude that the following statements are TRUE or FALSE?
-
AB support for the Conservatives changed little between 1997 and 2010.
-
AB support for Labour changed little between 1997 and 2010
-
C1 support for the Conservatives changed little between 1997 and 2010.
-
C1 support for Labour changed little between 1997 and 2001
-
C2 support for the Conservatives fell considerably between 1997 and 2010.
-
C2 support for Labour fell considerably between 1997 and 2010
-
DE support for the Conservatives fell considerably between 1997 and 2010
-
DE support for Labour fell considerably between 1997 and 2010
Click here for some further analysis of the current relationships between social class and voting behaviour
Section Two : The GeneraL Elections of 2010-2019
-
Now let us look carefully at the 2019 General Election. Fill in the following brackets for the 2019 General Election.
-
Fill in the brackets AB % Conservative =[ ]; AB % Labour = [ ]; AB % Liberal Democrat = [ ]
-
Fill in the brackets C1 % Conservative = [ ] : C1% Labour = [ ]; C1 % Liberal Democrat = [ ]
-
Fill in the brackets C2 % Conservative = [ ] : C2% Labour = [ ]; C2 % Liberal Democrat = [ ]
-
What does this tell you so far about the extent of social class differences in voting behaviour in 2019?
-
Now fill in these brackets DE % Conservative [ ]; DE % Labour [ ]; DE % Liberal Democrat [ ]
-
Would you accept the general conclusions that social class differences in voting behaviour as between social classes AB, C1 and C2 were negligible in 2010 ; that only the DE grouping was noticeably more pro- Labour and less pro-Conservative than the three other social classes; and that even among the DE grouping their support for Labour was significantly lower than it has been in the past?
Further Analysis
-
-
Social Class and Voting Behaviour 2010 and 2015: Analysis
Between 2010 and 2015 . There was However C2 voters were a slight increase in class voting.. An increased d percentage Both AB and C1 voted Conservative and a reduced percentage of AB voters voted Labour although there was a 1% increase in support for Labour among C1 voters. Also Among C2 and DE voters support for Labour increased and support for the Conservatives declined. However C2 voters were still just as likely to vote Conservative as to vote Labour.
The most noticeable trend was the decline in support for the Liberal Democrats in all social classes and the increased support for UKIP in all social classes. In percentage terms support for UKIP was particularly high among C2 and DE voters but since these social classes combined are now smaller than the AB and C1 social classes combined in numerical terms support for UKIp was higher in the AB and C1 social classes.
-
Social Class and Voting Behaviour 2015 and 2017: Analysis
In their summary of their statistical data Ipsos Mori combine the results of the ABC1 classes and C2DE classes and reach the following broad conclusion.
"The middle classes swung to Labour, while working classes swung to the Conservatives – each party achieving record scores. Although the Conservatives maintained a six-point lead among ABC1s, Labour increased its vote share among this group by 12 points since 2015. Similarly, while Labour had a four-point lead among C2DEs, and increased its vote share among this group, this was eclipsed by the 12-point increase for the Conservatives. This is simultaneously Labour’s best score among ABC1s going back to 1979, and the Conservatives’ best score among C2DEs since then"
-
Labour and Conservative improvements derived from the deterioration of support for UKIP ,the failure of Lib Dem support to recover and the slight decline in the Green vote in 2017 which IPSOS Mori did not register in their 2017 table and from the slight increase in turnout.
-
Between 2015 and 2017 both the Conservative Party and the Labour Party increased their share of the vote by 6% and 10% respectively mainly at the expense of UKIP whose vote declined by 11%. Both major parties also gained because of an overall increase in turnout and a switch of 2015 Green voters mainly to Labour.
-
Both the Labour Party and the Conservative Party increased their vote shares in all social classes.
-
In social classes AB and C1 the Labour Party increased its vote share by more than the Conservative Party
-
In social classes C2 and DE the Conservative Party increased its vote share by more than the Labour Party. It is noticeable that whereas in 2015 C2 voters split equally between Conservative and Labour Parties at 32% in 2017 the C2 voters were more likely to vote Conservative [45% ] than Labour [41%] mainly because C2 voters who deserted UKIP were more likely to switch to the Conservative Party than to the Labour Party.
-
DE voters who had voted UKIP in 2015 were also more likely to switch to the Conservatives to Labour which meant that the Labour lead among DE voters narrowed slightly between 2015 and 2017
-
Although the Labour Party were doubtless pleased that they had increased their vote share among working class voters they may well have been disappointed that the Conservative vote share among working class voters had increased by a larger percentage.
Social Class and Voting Behaviour 2017 and 2019
-
Support for the Conservative Party fell slightly among the AB classes but rose slightly among the C1, C2 And DE classes
-
Support for the Labour Party fell significantly among all social classes. Classes AB and C1 were significantly less likely to vote Labour than Conservative in 2019 but so too were C2 voters [47% Conservative and 31% Labour [ and even DE voters were more likely to vote Conservative than Labour [41% Conservative and 39% Labour].
-
This pattern of C2 voting behaviour in 2019 is highly significant but it should be noted that comparing the 2015, 2017 and 2019 General Elections what has happened is that C2 voters increased their support for the Conservatives very substantially in 2017 and indeed increased it further slightly again between 2017 and 2019 whereas although they had increased their support for Labour significantly significantly between 2015 and 2017 , in 2019 C2 support for Labour fell back to its 2015 level.
-
Clearly therefore it is necessary to look at the changing patterns of social class voting in longer term perspective rather than concentrating only on the changes between 2017 and 2019. In this respect this article by Peter Kellner [Prospect December 2019 and the following chart from the 2019 Ipsos Mori presentation may be useful
|
|
Additional useful information is provided in the You Gov 2017 and 2019 surveys which combine the AB and C1 social classes and the C2 and DE social classes and also provide information on social class support for the smaller political parties. [Some rows do not sum to 100% because of rounding]CHECK FIGURES again
.
Now let us look carefully at the 2019 General Election. Fill in the following brackets for the 2010 General Election.
-
Fill in the brackets AB % Conservative =[ ]; AB % Labour = [ ]; AB % Liberal Democrat = [ ]
-
Fill in the brackets C1 % Conservative = [ ] : C1% Labour = [ ]; C1 % Liberal Democrat = [ ]
-
Fill in the brackets C2 % Conservative = [ ] : C2% Labour = [ ]; C2 % Liberal Democrat = [ ]
-
What does this tell you so far about the extent of social class differences in voting behaviour in 2019?
-
Now fill in these brackets DE % Conservative [ ]; DE % Labour [ ]; DE % Liberal Democrat [ ]
-
Would you accept the general conclusions that social class differences in voting behaviour as between social classes AB, C1 and C2 were negligible in 2010 ; that only the DE grouping was noticeably more pro- Labour and less pro-Conservative than the three other social classes; and that even among the DE grouping their support for Labour was significantly lower than it has been in the past?