| Activity: What do you think about “Social Class”? 1. Look for a dictionary definition of “class” and write it down. 2. Assuming that you were asked to assess the social class position of a particular individual, list the factors which you would consider in making your assessment3. Which three factors in your list do you consider to be the most significant factors influencing an individual’s social class position?
|
The Measurement of Social Class
Objective Measures of Social Class
If we accept for the time being that there are three social classes in the U.K. we must then decide how to determine the class position of any particular individual. Sociologists emphasise that social class is essentially an economic concept and allocate individuals to social classes on the basis of their wealth, income and occupation.. Broadly speaking, we can say that a person with a relatively low income, working in a manual occupation and with limited personal wealth is working class. People with higher incomes working in non-manual occupations and with considerable personal wealth could be described as middle class. People with very high incomes working in non-manual occupations and those with no occupation but who receive high incomes from their high level of invested wealth may be described as upper class.
There are also other factors which might be considered relevant to the determination of a person’s class position such as the following:
- their education;
- the social background of their parents;
- their standard of living;
- their ownership of consumer durables;
- whether or not they own their own home;
- the value of their home if they do own it;
- their leisure pursuits
- their accent and dress ;
- their circle of friends and social connections ;
- their power and influence in society
This kind of information is certainly useful but, again broadly speaking, many of these factors are in any case closely connected with a person’s wealth, income and occupation. For example, people who are defined as upper or upper-middle class as a result of their wealth ,income and occupation are also likely to be well educated, to enjoy a high standard of living and expensive leisure pursuits and to mix with the kinds of people who can afford similar life styles, while consumer durables and homes are, in any case, part of individual’s personal wealth. Conversely, it is very unlikely that people in poorly paid manual work with limited personal wealth will enjoy high standards of living and expensive leisure pursuits. Therefore, in assessing people’s social class position, sociologists concentrate on income, wealth and occupation because the other factors which have been listed are in any case usually connected with income, wealth and occupation.
However some further clarification is necessary.
Firstly although, as we shall see later in this document, classification schema have been constructed in which occupation is used as the sole criterion of social class membership, these schema may provide insufficient information about the upper class in that some members of the upper class derive their high incomes from invested wealth rather than from their occupation and, indeed, in some cases, they may have no paid occupation whatsoever.
Secondly there are individuals who receive very high incomes and have accumulated large personal fortunes whoa re nevertheless difficult to allocate to social classes. Hypothetical examples might include working class people who have subsequently become self-made millionaire businessmen [usually, but not always, businessmen] and highly paid sportspersons and entertainers who also often originate from the working class and retain many of their working class characteristics.
Thirdly sociologists make an important distinction between social class which they see as an economic concept measurable by some combination of income, wealth and occupation and social status which is a measure of individuals’ social standing within their community. In many cases, individuals’ social status may be related to their social class membership as perhaps in the cases of judges, senior civil servants and consultant surgeons on the one hand and low paid, unskilled workers on the other. However this is not always the case in that for example nurses and members of the clergy may well have higher social status than would be suggested by their social class position while there might not be universal agreement that business leaders, bankers, journalists or politicians have high social status in society especially after the recent financial and political crises.
These points suggest that although we may see income wealth and occupation as the primary determinants of social class position it is also vital to consider other dimensions of social class membership. Thus members of the UK upper class are obviously wealthy but may also possess other important characteristics which suggest that wealth alone is not sufficient to guarantee membership of the upper class. For example members of the upper class will often exercise considerable economic and/or political power; they will often have been educated at private schools and/or prestigious universities; many may be conscious of their own class interests even if they are reticent about discussing them ; and they may share a range of cultural tastes and leisure activities. Consequently although in some cases the accumulation of wealth may facilitate social mobility into the upper class the extent of this social mobility will be restricted via various processes of social exclusion . On these bases the originally working class but now recently ennobled Lord Alan Sugar might perhaps now be seen as a member of the upper class whereas wealthy professional sportspersons and pop musicians would almost certainly not.
Addition: Social Class Measurement and the Great British Class Survey
Although many sociologists continue to assess social class membership in terms of some combination of income , wealth and occupation Professor Mike Savage and his colleagues in the Great British Class Survey have adopted an approach to the measurement of social class which is derived from the work of Pierre Bourdieu who has argued that social class membership should be assessed in terms of individual’s possession of economic capital, cultural capital and social capital.
The Subjective Dimension Of Social Class
When sociologists measure social class via any combination of income , wealth and occupation they are trying to provide an objective measure of individuals’ class position but they recognise also that individuals may disagree with the sociologist’s assessment of their class position and assign themselves to a different social class or, indeed to no social class at all ; for example Sir Paul McCartney is well known for his claims that he remains a member of the working class. In such cases the sociologist would conclude that there is a difference between the sociologist’s “objective” measure of social class position and the individual’s “subjective” measure of their own social class position. The sociologist would recognise also that these subjective assessments of social class may sometimes have a very significant impact on individual behaviour: for example there is good evidence that individuals who are objectively working class in terms of their occupation but nevertheless choose to define themselves as middle class are more likely to vote Conservative than individuals who are objectively working class and also define themselves subjectively as working class.
A Note On Social Mobility
It is possible that an individual’s social class position may alter during his/her life time and also that an individual’s social class position may be different from that of his/her parents.
For example the father of former Prime Minister Margaret Thatcher owned a grocer’s shop while the father of former Labour Party leader Neil Kinnock was a miner. Margaret Thatcher and Neil Kinnock have obviously moved upward in the UK class structure and would be described by sociologists as “upwardly socially mobile.”
Downward social mobility is also possible.
Sociologists distinguish also between an individual’s intra-generational social mobility [the social mobility which occurs within that individual’s lifetime] and an individual’s inter-generational social mobility [where an individual’s social class position is compared with the social class position of his/her parents at a similar age.]
Sociologists distinguish also between short range social mobility [as , for example when the child of unskilled manual workers becomes, say a bank clerk] and long range social mobility [as, for example in the cases of Margaret Thatcher and Neil Kinnock respectively]
Finally sociologists make a rather difficult distinction between absolute social mobility and relative social mobility where absolute social mobility refers to the amount of social mobility during a particular time period and relative social mobility refers to the chances of social mobility of people from different social classes during a particular time period. The study of social mobility and in particular the distinction between absolute and relative social mobility raises difficult technical issues which you will need to consider later in your course]. Click here for some introductory data on Social mobility from the BBC
Bearing in mind our conclusion that wealth , income and occupation are seen as the main determinants of social class position some additional information on wealth, income and occupation is now necessary.
The Distribution of Wealth and Income in the UK : Some Summary Data
The data on the distribution of Wealth and Income are statistically complex and I shall aim here to provide a concise summary of the data while avoiding some of the statistical complexities involved.
- The Distribution of Wealth in the UK
Whereas an individual’s current wealth refers to the value of assets which s/he has accumulated at a particular time, an individual’s income refers to receipts in the form of money or goods and services which an individual receives during a particular time period. Individuals may receive income in the form of wages /salaries, self-employment income, interest and/or profit from investments, rent , social security benefits of various kinds and goods and services although the latter form is relatively rare in market economies. [We shall consider issues surrounding the distribution of income a little later in this document.]
By wealth, we mean assets which are owned either by the government or by other institutions or by individuals and it is important to distinguish between these different types of wealth ownership. For example, the UK government owns many of its own buildings and much of the land on which they are built; local authorities own the council houses existing in their local authority area and companies in the private sector own land, buildings and machinery. Individuals also may own wealth, for example in the form of houses, consumer durables, cash, bank, building society and post office deposits, insurance and pension policies, unit trusts stocks and shares, land etc .
Here, we shall be looking at the distribution of wealth among individuals or what is usually known as the distribution of personal wealth. It turns out that personal wealth is not entirely easy to define and measure and economists and sociologists distinguish between marketable and non –marketable wealth and between marketable wealth including the value of dwellings and marketable wealth excluding the value of dwellings.
In order to describe the distribution of personal marketable wealth I shall be relying very heavily on official statistical sources but it is important to note at the outset that all official statistics on wealth and income are likely to understate the relative shares of the wealthy and large income earners since these individuals may adopt various strategies to conceal the real extent of their wealth and/or income. Furthermore, if and when some redistribution of incomes takes place it is important to assess the extent to which this is merely a redistribution of income within rich families undertaken as a means of reducing Estate Duty/Inheritance tax rather than a significant redistribution from the rich to the poor.
The following two tables are now a little dated but still useful for a recent historical perspective. More recent data from ONS publication are provided a little later in the document.
Table 1 : Shares of Personal Marketable Wealth owned by Various Percentages of the UK Population aged over 18 [Source: HM Revenue and Customs]
UK Personal Marketable Wealth
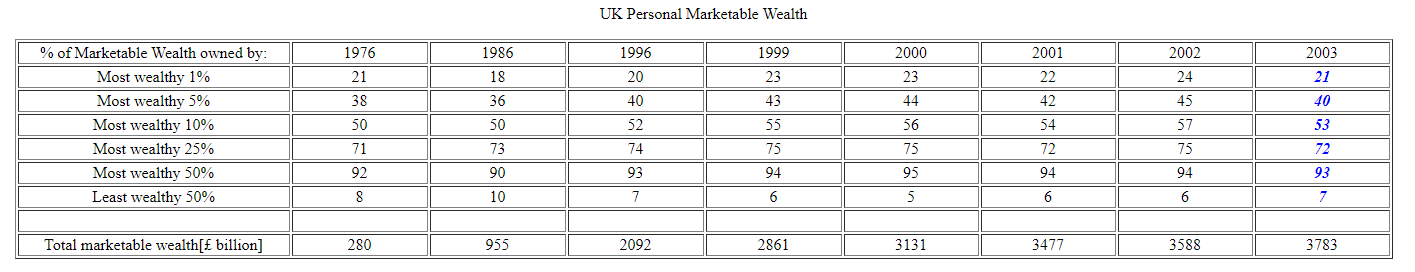
Table2 : Shares of Personal Marketable Wealth [excluding the value of dwellings] owned by various Percentages of the UK Population aged over 18 [Source: HM Revenue and Customs
UK Personal Marketable Wealth [excluding the value of dwellings]

Using the above data it can now be shown that statistics on the distribution of personal marketable wealth among individuals vary considerably depending upon whether or not we include the value of dwellings in the definition of wealth.
In the top section of the table where the value of dwellings is included in the definition of personal wealth, the overall share of the top 1% of wealth owners is rather less than when the value of dwellings is excluded from the definition of personal wealth.
The distribution of personal wealth tends to be rather more equal when the value of dwellings is included in the definition of personal wealth because many “lower middle class” and “upper working class people” may have rather limited financial wealth but own their houses worth perhaps £150,000 -£250,000 which makes the distribution of personal wealth appear more equal once the value of dwellings is included in the definition of personal wealth.
You should notice, however that even when marketable wealth is defined to include dwellings the least wealthy 50% of wealth owners owned only 6% of marketable wealth in 2003.
| Activity: As an exercise in the use of social statistics please use Table 1 to answer questions 1-4 and Table 2 to answer question 5. [As already mentioned the data in these tables are now a little dated but I hope that the exercise will still prove to be helpful !] 1.Using the definition of personal marketable wealth to include the value of dwellings [i.e. using the Table 1 data] what proportion of personal marketable wealth was owned by the richest 1% of wealth owners in 1976? |
2. Using the same definition of personal marketable wealth what happened to the wealth share of the richest 1% of wealth owners between 1976 and 1996 and between 1996 and 2003?
3. Using the same definition of personal marketable wealth what happened to the wealth shares of the richest 50% of wealth owners between 1976 and 2003?
4. Using the same definition of personal marketable wealth what happened to the wealth share of the least wealthy 50% of wealth owners between 1976 and 2003. [You will need to do a subtraction!]
5. Using the definition of personal marketable wealth which excludes dwellings [i.e. using the table 2 data] what percentage of marketable wealth was owned by the least wealthy 50% in 2003. {You will need to do a subtraction].
The Distribution of Personal Marketable Wealth and Personal Non-marketable Wealth.
We have seen above that statistical trends in the distribution of personal marketable wealth vary depending upon whether personal marketable wealth is defined inclusive or exclusive of the value of dwellings. However the statistical trends vary also depending upon whether personal wealth is defined to include only personal marketable wealth or the sum of personal marketable wealth and the value of state and private pension rights which is defined as a non-marketable form of personal wealth. For example, an individual who has paid into state and/or private pension schemes and who is lucky enough to live, say to the age of 100 will receive a substantial amount of money in the form of pension payments between retirement and death and these pension rights to future income are defined as personal non-marketable wealth in the sense that these future pension rights cannot be transferred to other individuals in the same way as is possible with marketable wealth.
Various statistical methods involving the calculation of average life expectancy and future rates of pension receipts may be used to estimate the value of non-marketable wealth and when this is included in the definition of wealth, the overall distribution of personal marketable and non-marketable wealth combined can be shown to be more equal than the distribution of personal marketable wealth taken in isolation.
The most recent official source for Wealth statistics is Office of National StatisticsPublication: Wealth in Great Britain 2012-2014 . Among the key points made in this document are the following.
- Aggregate total wealth [including private pension wealth] of private households was £11.1 trillion in 2012-14.
- Aggregate total private household wealth can be divided into property wealth [net of outstanding mortgages]{35%}, financial wealth [net of debt]{14%}, physical wealth{10%} and private pension wealth{40%}. The figures in brackets show the percentages of aggregate total wealth held the in different categories in 2014 . Calculation of private pension wealth involves some technicalities which are explained in the report.
- In 2012-2014 the top 10 % of private wealth owners owned 45% of aggregate total private household wealth; the next most wealthy 40% owned 46% of aggregate total private household wealth and the bottom 50% owned 9% of aggregate total private household wealth
- In 2012-14 to fall within the bottom 10% of wealth owners one’s wealth would have to be £12,600 or less; the median level of wealth was £225,100; to fall within the top 10% of wealth owners required wealth of £1,048,500 or more ; to fall within the top 1% of wealth owners required wealth of £2, 872, 600 or more.
- Aggregate total wealth [ including private pension wealth] of private households rose by 18% since 2010-12 but the increase was 21% for the most wealthy 10%, 17% for the next most wealthy 40% and 7% for the least wealthy 50%
Several of these points are illustrated graphically in the full report
Detailed information on the Distribution of Wealth in the UK from Professor Karen Rowlingson . This provides a detailed analysis but again in relation to slightly earlier statistics
- The Distribution of Income: Some Summary Data
Once again several technicalities are involved in the measurement and analysis of the distribution of income but for the purposes of this document is sufficient to make the following key points.
- An individual’s income prior to the payment of income tax and all other taxes and any receipts of social security benefits is known as Original Income. We can then show that Original Incomes are distributed rather unequally in the UK .
- However Original Incomes are distributed less unequally than personal wealth in the UK.
- An individuals income after the payment of income tax and other taxes and the receipt of social security benefits in cash and in kind is known as Final Income.
- The net effects of taxation and social security benefits are to redistribute income from high income recipients to low income recipients.
- Therefore Final income is distributed more equally than Original Income in the UK. However important disputes remain as to whether or not still greater income equality is required. What do you think? Why?
The Office of National Statistics publishes annual information on the distribution of income in May/June of each year.
The Office of National Statistics provides information on trends in the distribution of income at various levels of complexity. You may click here for a detailed ONS article in which Figure 3 contains detailed information for the 2017 distribution of income. Scroll down this article to fig 3. for the inter-relationships between the different types of Income defined above showing the effects of taxes and benefits on the distribution of income such that final income is seen to be more equally distributed than original income.. You may also download figure 3 along with the actual numerical data on which the figure is based. Also Figure 17 provides data on long term trends in the distribution of income as measured by trends in the Gini Coefficient which is explained below.
.
| Activity [The following activity is based partly on the 5 points listed above and partly on the linked data from the above ONS article on the effects of taxes and benefits on the distribution of income 2017.]1.Define Original Income.2. Look at the Figure 3 of the ONS article on 2017. What average original incomes were received by average members of the top and bottom quintiles in 2017?
3.Using Figure 3 compare the original incomes and the final incomes of the top and bottom quintiles in 2017 4.Explain what measures the UK government takes to make the distribution of Final Income more equal than the distribution of Original Income. 5. State one possible reason why this type of government activity may be justified and one possible reason why this type of government activity may be unjustified . |
- Trends in the Distribution of Income:
Sociologists, economists and others are also very keen to measure changes in the distribution of income over time. In the era of Margaret Thatcher’s Conservative Governments 1979-1990 income inequality increased considerably for example because of the relatively fast rate of increase in the original incomes of high income earners, changes in taxation which benefited high income earners disproportionately, the high levels of unemployment and the slow growth of social security benefits both of which affected low income groups adversely..
Income inequality narrowed slightly under the Conservative premiership of John Major but there has been little or no further reduction in income inequality under Labour Governments from 1997 to the present day. all of which means that income inequality in the UK is considerably greater now than when Mrs Thatcher came to power in 1979. Neither John Major nor Tony Blair nor Gordon Brown have reversed the increases in income inequality which occurred under Mrs Thatcher.
Mrs Thatcher and her colleagues supported increased income inequality as a means of restoring financial incentives which , it was hoped, would increase economic efficiency. Labour governments, as supporters of a social democratic ideology, might have been expected to reverse the growth of income inequality which occurred between 1979-1990 but they did not do so, partly because Tony Blair and his colleagues accepted New Right/Thatcherite economic arguments in favour of increased inequality , partly because they believed that in globalised markets higher UK income taxation would encourage talented business people to move abroad and partly also because their electoral strategy depended for its success on the support of middle class voters who may have been alienated if Labour had increased income taxation on the relatively rich. Left wing critics of “New Labour” have argued , therefore that It has retreated from social democratic principles , a charge which Mr Blair and co. of course deny for example on the grounds that even if overall income inequality has increased the government has at least succeeded in reducing the extent of the rise in inequality.
Under the Coalition Government of 2010-2015 Income inequality did fall very slightly but it remained much higher than had been the case in the pre-Thatcher era. . Here are some tricky statistical issues which you can pursue later in your course.
- Recent Trends in the UK Distribution of Income: Some Further Details
If we wish to understand the distribution of income in more detail we must familiarise ourselves with Lorenz Curves and Gini Coefficient..

- The diagonal illustrates the line of perfect income equality because it implies that every single member of the population receives an identical income such that the lowest 10% of income recipients receive 10% of national income as do the next lowest 10% of income recipients and so on.
- If f national income is distributed along the horizontal and then the vertical axis this would imply that national income distributed perfectly unequally since every member of the population would receive zero income apart from the single highest income recipient who would receive the entire national income for him/herself.
- The actual degree of income inequality in a society is shown by the area between the diagonal and the Lorenz curve measuring the actual distribution of national income in the society.
- In the above diagram the lowest 20% of income recipients receive approximately 5% of the national income. If you imagine another Lorenz curve which is further from the diagonal, the distribution of national income shown on this second Lorenz curve would be more unequal than the Lorenz curve actually shown in the diagram
- In general the closer the actual Lorenz Curve is to the diagonal the greater the degree of equality in the distribution of national income and vice versa.
- In terms of the above diagram the Gini Coefficient= Area A / Area A+B: that is Area A divided by Area A+B.
- If there is total equality there is no area between the diagonal and the Lorenz curve because the Lorenz curve would be the diagonal.. Therefore A=0 and using the formula A/A+B=0, the value of the Gini coefficient is 0.
If there is total inequality , B=0 and A/A+B=1 and the value of the Gini coefficient is 1. Thus the value of the Gini Coefficient can vary between 0 and 1 and the smaller the Gini Coefficient, the more equal the distribution of income. However you will find also that the Gini Coefficient is calculated in percentage terms varying from 0% [Total equality] to 100% [Total inequality]. Data on trends in the UK Gini Coefficient measured in percentage terms appear below. - Some more technical details are involved in the further analysis of Lorenz curves and Gini coefficients but at least this note gives you a basic explanation of Lorenz Curves and Gini Coefficients which will enable you to follow the following Department of Work and Pensions data to which we now turn.
The following table is adapted from various editions of the annual publication Households below Average Income published by the Department of Work and Pensions.. It makes use of the Gini Coefficient which has been explained above and shows an overall increase in income inequality between 2002/3 and 2009/10s . This growth of income inequality was and is to some extent embarrassing to the Labour Government, subsequently the Labour Opposition although Labour has claimed that its taxation and social security policies at least reduced the growth of inequality below what it would have been if previous Conservative taxation and social security policies had continued.
Under the Coalition there has been some reduction in income inequality between 2009/10 and 2010/11 after which the level of income inequality measured by the Gini Coefficient has been fairly static. The Coalition could therefore claim that it had slightly reduced income inequality below the level left by the Labour Government but the IFS has argued that income inequality may well increase again in the future.
{You can find here the 2018 Summary DWP publication which contains data for 2016/17]

[One technical detail is that the Office of National Statistics provides similar information with slightly different calculations in the value of Gini Coefficients due to slightly different measurement methods]
The Distribution of Wealth and Income in the UK: Summary
The data provided above suggest that in terms of the distribution of wealth and income, the UK remains an economically unequal society in the early 21st Century and this conclusion may be taken to imply the continued existence of social class differences although some sociologists argue that although there are significant inequalities as between individuals, these individuals see themselves less and less as members of particular social classes. This is a post modern perspective which suggests that the existence of social inequalities does not prove the existence of social class. It too will require further study.
Occupation as a Measure of Social Class :Some Advantages and Disadvantages.
[For examination purposes you will need to investigate these various occupational class schema in some detail]
Several classificatory schema [both official and unofficial] have been developed in which individuals are allocated to broad “social classes” on the basis of their occupations. Official social class schema include the Registrar General’s Classification [ first introduced in the UK Census of 1911] and the NS-SEC classification which replaced the Registrar General’s Classification in 2001.Unofficial schema include the Hall-Jones Scale and the schema devised by the Institute of Practitioners in Advertising which has been used regularly by sociologists to analyse relationships between social class membership and voting behaviour. [In this scheme occupations are classified as AB, C1, C2, and DE . You may click here to see the linkages between social class and voting behaviour from October 1974 and 2010]
The use of occupation as a measure of social class may be supported on the following grounds.
- It is relatively easy to understand .
- I has enabled sociologists to demonstrate the existence and significance of social class differences in educational achievement, health, life expectancy, voting behaviour, religious observance and so on.
However problems associated with the use of occupation as a measure of social class include the following:
- Whatever occupational scale is used, the effect is to exclude members of what might be called “the upper class” who derive their incomes from the investment of their wealth, not from their occupation. Indeed, in some cases, these people may have no occupation.
- Although the scales may help to describe the overall class structure, sociologists aim to analyse the concept of class and the relationships among social classes in more detail. Occupational scales have nothing to say about the extent to which relationships among classes are based upon conflict or upon consensus or about the importance of class consciousness.
- In some cases, occupations may be assigned to a relatively high occupational group although income earned in the occupation may be relatively low. Priests and vicars are possible examples.
- members of the working class have lower average life expectancy;
- Click here for data from ONS on social class differences in life expectancy [2022]
- The schemes cannot distinguish effectively between single income and double income families. If a couple are both in paid employment, they and their children may enjoy a relatively high standard of living even if they are both in a relatively “low class” occupation. (Unfortunately, however, it seems that it is increasingly the wives of highly paid men who are themselves more likely to be in well paid jobs and this is a factor which is leading to increasing income inequality.)
- Bearing in mind these possible advantages and disadvantages we shall concentrate below on recent information presented via the use of the NS-SEC classification.
The National Statistics Socio-Economic Classification [NS-SEC]
Click here and then in the table of contents click on section 8 National Statistics Socio-economic Classification [NS SEC] for the data on the NS SEC in the 2011 Census subdivided by Gender