Classless update poverty
Long Term and Short Term Trends in Income Inequality and Poverty 1961/62- 2021/23
Overall trends in the distribution of income may be summarised by the Gini Coefficient which varies between 0 and 1 or between 0% and 100% where the larger the Gini Coefficient the greater is the degree of income inequality.
The annual DWP publications entitled Households below average Incomer provide detailed information on all aspects of Poverty and Inequality and the following diagrams are taken from this 2024 publication.
The measure of income adopted is net equivalised disposable Household income.
The data show that income inequality increased significantly in the Thatcher era but has changed little thereafter.
Click here for some technicalities surrounding the measurement of national income and redistribution trends.
Gini Coefficient : Long term trend.

Gini Coefficient : Short term trend

Click here for long term data on the Gini coefficient and the 90L 10 ratio
Click here for Household income inequality UKL Financial Year ending 2022
Click here for MPs question Rishi Sunak – Liaison Committee 10 December 2023
Click here for Poverty in the UK: Statistics from the House of Commons Library.
This Report contains detailed information on all aspects of poverty in the UK. It is noted that poverty may be defined in a variety of ways but that it is usual to distinguish between Absolute Poverty [ measured via Absolute Low Income ] and Relative Poverty [measured via relative low income ]as indicated in the following extract from the Report.
“How is poverty measured?”
“Two commonly used measures of poverty based on disposable income are: • Relative low income: This refers to people living in households with income below 60% of the median in that year. • Absolute low income: This refers to people living in households with income below 60% of median income in a base year, usually 2010/11. This measurement is adjusted for inflation Median income is the point at which half of households have lower income and half have higher income. Income can be measured before or after housing costs are deducted.”
It is noted later in the Report that the detailed estimation of the extent of poverty involves some technicalities.
For example , because the estimation of the extent of poverty involves the use of the national rate of inflation even though individuals in lower income groups experience a higher rate of inflation in most but not all years this means that rates of absolute poverty will in many years be underestimated, [Click here for Poverty in the UK: Statistics .See pp 10-11]. Also click here for BBC analysis of this issue.
However, conversely, the under reporting of benefit incomes is likely to inflate poverty estimates. [Click here for Poverty in the UK: Statistics. See PP 16-17].
UK Poverty trends are illustrated in the following diagrams from a recent DWP Households below Average Income [ These data are also used in Poverty in the UK: Statistics]
Trends in Rates of Relative Poverty and Absolute Poverty

Trends in Rates of Absolute Poverty [Absolute Low Income]
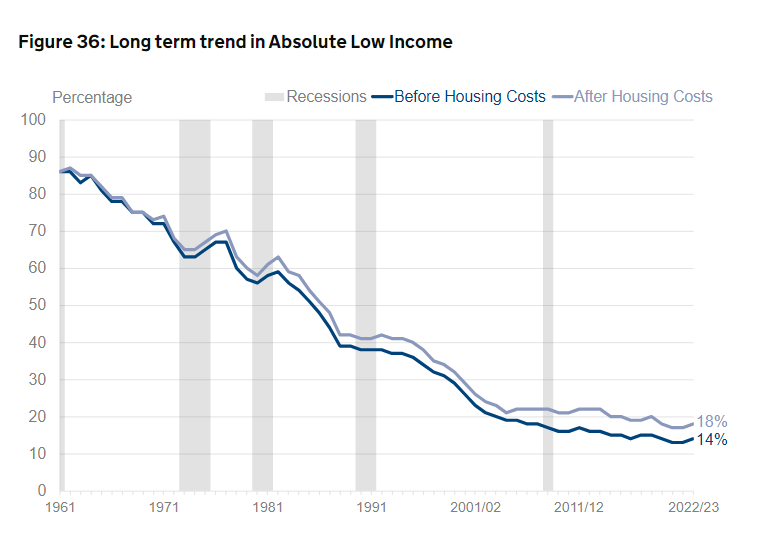
Longer Term Trends
These data indicate that the rate of relative poverty increased significantly in the Thatcher era and then trended downwards till around 2010 since when there has been a slight upward trend. Relative poverty rates are higher now than in 1961.
Absolute poverty rates are now much lower than in 1961 and have also trended slightly downwards since 2010. However, the most recent data indicate that the rate of absolute poverty increased between 2021/22 and 2022/23 and you may Click here for brief BBC coverage of this.
Future Predictions
The Resolution Foundation estimates that Absolute Poverty is likely to rise soon, but that relative poverty is likely to fall in 2023/24 and to rise thereafter , [Click here for Poverty in the UK: Statistics .See pp 15-16 for references to the conclusions of the Resolution Foundation Report]. Conclusion
My overall conclusion is that although there has been a significant fall in the rate of absolute poverty since 1961, the increases in income inequality and relative poverty of the Thatcher tears have not as yet been reversed which suggests that , if assessed in terms of these trends , there has not been a trend toward classlessness in UK society in recent years .