The Working Class
This topic is divided into Three Sections and Eight Parts as indicated below
Section One
Part One: Sociological Theory and the Working Class
Part Two: Recent Statistics The Definition, Measurement and Size of the Working Class.
The Registrar General’s Classification
The NS SEC System
The Approximated Social Grade System
The Great British Class Survey
Claire Ainsley and the New Working Class
The British Social Attitudes Survey from the National Centre for Social Research
Click here for l information on the CAMSIS Scale from the Easy Sociology website and here for information from The University of Stirling. There is a very useful evaluation of the CAMSIS Scale in Class in Contemporary Britain by Ken Robets [Second Edition 2011]
Part Three: The Working Class, Living Standards and Life Chances
Part Four: The Boundary between the Working Class and the Middle Class: Proletarianisation and Embourgeoisement
Part Five: The Working Class: Structure, Consciousness and Action
Part Six: The Working Class, the Underclass and the Precariat
Part Seven: The Fragmentary Working Class: Class. Gender, Ethnicity, Age, Disability, Sexuality
Part Eight: Summary
Return to the Teaching Notes on Differentiation and Stratification Page for differing perspectives on social stratification.
Section One: Part One: Sociological Theory and the Working Class
Before analysing the working class, it is necessary to note some of the controversies within Sociology surrounding the definition of "social class" itself. Thus, sociologists may well disagree as to how "social class" should be measured, how many social classes exist, as to the significance of divisions within social classes, as to where the boundaries among the social classes are, as to relationships between the social class and as to the extent of social mobility between social classes.
Although we might initially adopt a simplified working definition of social class as “a large group of people whose economic circumstances, usually measured by their occupations, incomes and wealth are broadly similar” it is also necessary to recognise the importance of the divisions within the working class. Differences in skill may well result in differences in income and possibly in differences in authority in the work place and working conditions. Divisions within the working class may intensify due to ethnic, gender and other non-class differences within the working class and because of differing opinions, say toward politics in general and toward issues such as Scottish and Welsh independence and, most recently, to Brexit.
Sociologists also distinguish between objective and subjective aspects of social class membership and have also discussed membership of the working class via the so called SCA approach to class analysis which focuses on the extent to which class structures might or might not affect class consciousness and class action.
- Contemporary sociological studies of the working class are often heavily influenced by classic Marxist and/or Weberian perspectives. In his best known theory Marx distinguishes between a property owning Bourgeoisie and a property-less Proletariat [the working class ]. Marx argues that the economically dominant Bourgeoisie is also a politically dominant ruling class in that it indirectly controls the state which governs in its interests rather than in the interests of the relatively powerless Proletariat. This means that in analysing the working class Marx argues that we must also focus on the limited political power of the working class. However, there are competing theories of political power which are outlined here
Marx noted that intermediate strata do exist under capitalism but that these will eventually disappear via a process of class polarisation moving either upwards into the Bourgeoisie or downwards into the Proletariat. However, in his later work Marx does allow for the expansion of the intermediate groups although the focus of attention is still the Bourgeoisie and the Proletariat. The objective and subjective dimensions of class are also crucial in Marx' theory in that the revolutionary transition to socialism will be possible only when the proletariat or working class has developed its own class consciousness and transformed itself from a class in itself to a class for itself.
- Weber, while recognising that class membership depends upon the ownership of wealth, claims that it depends also upon market situation (the opportunity for income, fringe benefits, promotion and pension rights) Since no two persons' market situations are identical, there can in principle be a very large number of social classes but in practice Weber argues that a 4 class model of capitalism is appropriate using as his 4 classes the propertied upper class, the property-less white collar workers, the petty bourgeoisie and the manual working class, arguing also that there are. significant divisions within these classes.
Weber distinguishes also between class, status, and party. By "status" is meant one's standing in the community and according to Weber the existence of important status divisions within the working class (for example between skilled and unskilled workers, males and females and different ethnic and/or religious groups) may inhibit the growth of working class consciousness and hence the likelihood of a class-based revolutionary overthrow of capitalism, which according to Weber is in any case not necessarily desirable. By “Party” Weber meant not only political parties but all the organisations in which power might be exercised such as pressure groups., societies and clubs.
Whatever their differences the work of Marx and Weber does demonstrate the importance of the objective and subjective dimensions of class.
- In Functionalist theories of social stratification there is an emphasis on the graduated divisions within the occupational structure rather than on social class divisions as such and in these theories, it is argued that differences in income and wealth are both inevitable because they derive from individual differences in talents and abilities and desirable because the generate the economic incentives necessary to promote economic growth. This would in turn explain why incomes in working class occupations were lower than in middle and upper class occupations. However, the functionalist approach to social stratification has been roundly criticised by non- Functionalist sociologists.
- New Right theories of social stratification have much in common with Functionalist theories
- From the 1970s onwards it was increasingly argued that globalisation has resulted in the expansion of international trade leading to the substantial relocation of manufacturing industry from advanced capitalist countries such as the UK to the Global South where labour costs are much lower and this, coupled with increased labour productivity in the advanced capitalist countries, has led to a process of de-industrialisation involving the decline of manufacturing employment especially in unskilled and semi-skilled occupations.
Essentially it was being argued that both domestic and international economic trends have resulted in a shift from Fordism to Post-Fordism with the result that the overall size of the managerial, administrative, professional classes would increase while the size of the traditional working class would decline. Also, within the shrinking working class there would be increased employment for well-educated core workers and reduced demand for semi-skilled and unskilled peripheral workers.
However, in his critical assessment of the UK education system, Patrick Ainley (Betraying a Generation: How Education is Failing Young People 2016) has argued that the extent of transition from Fordism to Post-Fordism has been much overstated, and that although some parts of the economy may have developed in a post-Fordist direction, others could be described as operating under conditions of Neo-Fordism. Thus, he argues that although increasing numbers of students have graduated from university, many have failed to secure graduate-level employment because of the relatively slow growth of graduate-level jobs: they are essentially GRINGOS (graduates in non-graduate occupations). Meanwhile, the service sector of the economy has seen the growth of routine, tightly supervised, poorly paid jobs (often on zero hours contracts offering very limited job satisfaction in call centres or fast food outlets or in social care where at least the level of job satisfaction may be much higher even if working conditions are difficult. [This study was written before the onset of COVID 19 which highlighted the difficulties faced by care workers]. To download a short review of Patrick Ainley’s book – Click Here
- Some theorists of Late Modernity and Postmodernity deny the usefulness of the concept of social class. Thus, in his study Risk Society(1992), Ulrich Beck argued that capitalist societies were changing in important ways which rendered the concept of social class as a zombie concept increasingly irrelevant as a category of social analysis. This view is to some extent similar to the views of post-modernist sociologists Jan Pakulski and Malcolm Waters, who argued in their book The Death of Class that even if capitalist societies did remain unequal, they could best be described in terms of classless inequality, given their belief in the declining salience of social class. You may click here for further information on these theorists but it should be noted that many sociologists are critical of these Late Modernist and Postmodernist theories and instead continue to see the analysis of class structures as central to the analysis of modern societies.
- The Great British Class Survey (GBCS) was devised by Professor Mike Savage and a large team of researchers with the intention of developing a distinctive approach to the analysis of the UK class structure based upon the theoretical ideas of Pierre Bourdieu. Consequently, in this new model of the UK class structure an individual's social-class position was to be assessed by his/her possession of economic, cultural and social capital rather than by the criteria used in the well-established official NS SEC class schema. There would thus be a measure of controversy among analysts committed to the different approaches, although Professor Savage has emphasised that his aim has always been to complement the NS SEC schema rather than to replace it.
- In the early Twentieth Century working class men were far more likely than working class women to be in paid employment and these men were especially likely to be employed in the Primary sector [mainly agriculture and mining] and the secondary sector of the economy [ mainly manufacturing and construction.] However, by the 21st Century far more women [including working class women] were in paid employment and employment in the primary sector of the economy and in manufacturing has declined very significantly. Far more working class men and women are now employed in the tertiary sector of the economy. Detailed information on these employment patterns may be found in this ONS document. For example
“The primary sector share of employment decreased consistently over time, from 14.3% in 1920 to 1.3% in 2016. Secondary and tertiary sector employment shares were 34.2% and 51.5% in 1920, respectively. From 1966 onwards, the tertiary sector share of employment increased significantly to reach 83.6% of total employment in 2016. Over the same period, the secondary sector share of employment decreased to reach 15.1% of total employment in 2016. These changes show how the UK economy evolved to become more services-sector driven.”
- As mentioned above several social class theorists argue that in the analysis of social class it is necessary to distinguish between structure, consciousness and action. Data from the NS SEC and the GBCS suggest that the size of the working class is uncertain and recent trends in voting behaviour suggest that very, very few working class people come close to espousing a revolutionary political ideology. Support in General Elections for radical left political parties from voters of all social classes is very low and although a plurality of working-class voters has often voted Labour, many working class voters vote for the Conservatives, the Liberal Democrats, for Ukip and subsequently the Brexit Party and Reform, and for Nationalist political parties. It had been argued that working class support for Labour increased in 2017 because of the increased radicalism of the Labour Party under the leadership of Jeremy Corbyn yet in the 2019 General Election working class voters were more likely to vote Conservative than Labour.
Click here for YouGov poll data and choose from the menu to find C2 and DE attitudes to the Labour Party. [ Takes one-two minutes to load]
Section One: Part Two: Recent Statistics on the Measurement of Social Class
Introductory Summary
Various statistical schemes have been used to delineate the overall shape of the “UK” class structure and the size of the working class within that structure although some of the statistics refer to the England and Wales only rather than the UK.
The Registrar General’s Classification: [45% of employees were working class in 1991].
THE NS SEC System :38.1% of Households based on Household Reference Person] were working class in 2021.
The Approximated Social Grade System: 44.1% of Households based on Household Reference person were working class in 2021
The Great British Class Survey: 48% of survey respondents were in the final three class categories of the GBCS which might be seen as comprising the working class although it could be argued that some new affluent workers are also part of the working class.
Claire Ainsley and the New Working Class: Claire Ainsley includes the final three categories of the GBCS in her definition of the New Working Class but also states that. “It is possible that some members of the technical middle class [6%] and new affluent workers [15%] might identify as working class depending on their class background and societal associations but they are not core to the definition of the New Working Class”
The National Centre for Social Research: British Social Attitudes 40: Social Class. Answering the unprompted question in 2022, 46% of respondents identified as working class and 29% identified as middle class. 22% identified with no social class Answering the prompted question in 2021, of respondents who did not initially identify with any social class 52% now identified as working class and 43% now identified as middle class. It is important to note that many respondents who were objectively middle class in terms of occupation nevertheless identified as working class.
Another important conclusion of the Survey is that “There is no consistent evidence that people have become less likely to identify as middle or working class, while, despite the growth in white-collar jobs, more people identify as working than middle class. At the same time people are more aware of class inequalities in Britain.”
In any case, as is indicated elsewhere on this site , detailed analysis of the proletarianisation theory and the embourgeoisement theory indicate that the boundary between the middle class and the working class is uncertain
I now present some further details on the measurement of social class beginning with the Registrar General’s Classification.
The Registrar General’s Classification
The following table [ which is adapted from Class in Britain [1998] by Ivan Reid] illustrates the distribution of the population of Great Britain aged 16 and over by RG social class in 1991. It is notable that males were disproportionately more likely than females to be found in RG Social Classes 1 and 111 Skilled manual and that females were more likely than males to be found in RG Social Class 111 Skilled Non-manual. Gender differences in RG Social Class11, 1V, and V were smaller. The blue figures in the table refer to the percentages of each RG social class accounted for by males and females respectively
| RG Classification 1991 | All Employees Percent 1991 | Male Employees Percent 1991 | Female Employees Percent 1991 |
| 1. Professional etc occupations | 4 | 7 82 | 2 18 |
| 11. Managerial and technical | 27 | 28 55 | 26 45 |
| 111nm Skilled non-manual | 24 | 11 25 | 39 75 |
| 111m. Skilled manual | 21 | 33 83 | 8 17 |
| 1V. Partly skilled occupations | 17 | 16 51 | 18 49 |
| V. Unskilled occupations | 7 | 6 45 | 8 55 |
| Total | 100% | 100% | 100% |
THE NS SEC Classification
In 2000 the NS SEC class schema was introduced. This was a 7-class schema [subsequently increased to 8 classes] which was very similar to the schema which had been used in the Oxford Social Mobility Study
Click here for an official description of The National Statistics Socio-economic classification [NS SEC]. I shall summarise only the main characteristics of the NS SEC scheme here and further details may be found in the above publication.
The aim of the NS SEC classification is to facilitate the allocation of individuals to NS SEC classes based upon their employment relations. Thus, the following distinctions are made in the construction of the NS SEC Scheme.
The distinction between employers, employees and the self-employed
The distinction between service contracts, labour contracts and intermediate contracts
Distinctions among occupations based upon their labour market situation [ sources of income, economic security and promotion prospects and their work situation [degree of authority or control exercised in the workplace.]
Individuals are then categorised into an occupation taken from the Standard Occupational Classification and then allocated to one of the 8 NS SEC analytic categories [Click here and scroll down to Table 1] but the NS SEC scheme is also divided into a larger number of operational categories and subcategories [Click here and scroll down to Table2.]
However, in the NS SEC classification occupations are not classified based on whether they are non-manual or manual and it is the routine and semi- routine occupations [NS SEC 6 and 7] which are generally described as working-class occupations. [However, in one important recent comparison NS SEC 5[Lower supervisory and technical occupations] and the Never worked and long term unemployed are also included as part of the working class. Click here and scroll down to Section Three of an ONS document for further discussion. ]
It is also important to note also that the RG classification was hierarchical or ordinal in the sense that each social class is ranked higher than the one below it whereas the NS SEC classificatory scheme is not entirely ordinal or hierarchical. Thus, Although NS SEC 1 and 2 might be seen as higher NS SECs than NS SECs 3-7 and NS Secs 6 and 7 might be seen as lower than NS SECs 1-5, NS SEC class 3, 4 and 5 cannot be ranked hierarchically. Section 8 of the official publication is entitled Classes and collapses and Table 3 in this section indicates that there are eight, five and three class versions of the analytic class scheme
In the following subsection, I refer initially to extracted official data which refer to the NS SEC class positions of individuals, but these are followed by data which refer also to the NS SEC Class positions of Households defined by the NS SEC Class position of the Household Reference Person of each household and to similar data from the Approximated Social Grade System.
Click here, and then in the table of contents click on Section 8: National Statistics Socio-economic Classification (NS SEC) for data on the NS SEC in the 2011 Census, subdivided according to Gender. [Note that the 2011 data refer to UK data taken from the 2011 Census and from official Scottish and Northern Irish data whereas in the table below the data for 2001 and 2021 refer to England and Wales only.] Click here for NS -SEC data from the 2021 Census which refer only to England and Wales and click here for a diagram illustrating membership of NS SEC class by gender.
Percentages of usual residents aged 16 or over in NS SEC Categories [England and Wales 2001 and 2021; UK 2011]
| NS SEC category | Examples of occupations in each NS SEC category | 2001 Census % | 2011 UK data % | 2021 Census % |
| 1. Higher managerial, administrative, and professional occupations | 11.9 | 10.0 | 13.1 | |
| 1.1 Large employers and higher managerial and administrative occupations | Large employers, chief executives, senior civil servants, financial managers, production managers | 2.3
|
||
| 1.2 Higher professional occupations | Scientists, pharmacists, dentists, university teachers, civil, mechanical and electrical engineers, lawyers | 7.8 | ||
| 2. Lower managerial, administrative, and professional occupations | General managers in small companies, lower grade civil servants, nurses, schoolteachers, social workers | 24.2 | 20.7 | 19.9 |
| 3. Intermediate occupations | Clerical workers, library assistants, nursery nurses, secretaries | 12.5 | 12.7 | 11.4 |
| 4. Small employers and own account workers | Shopkeepers, publicans, electricians, plumbers, builders | 9.1 | 9.2 | 10.6 |
| 5. Lower supervisory and technical occupations | Foremen, supervisors, laboratory technicians, printers | 9.4 | 7.0 | 5.4 |
| 6. Semi-routine occupations | Chefs, cooks, fitters, sales assistants, care assistants | 15.5 | 14.2 | 11.4 |
| 7. Routine occupations | Bar staff, bus drivers, cleaners, refuse collectors, warehouse workers | 12.3 | 11.3 | 12.1 |
| 8. Never worked and long-term unemployed | 5.0 | 5.6 | 8.5 | |
| L14.1 Never worked | 3.8 | |||
| L14.2 Long-term unemployed | 1.8 | |||
| L15 Full-time students | 9.0 | 7.7 |
The data for 2091 2011 and 2021 are not strictly comparable but in NS SEC classification categories 6 and 7 are assumed to correspond to working class occupations and these account for 27.8%, 25.5% and 23.5% of the adult population in 2001 [England and Wales], , 2011[UK] and 2021 [England and Wales] respectively .
The Analysis and Composition of Social Classes: Individuals or Households?
On the choice of an appropriate unit of analysis, the following quotation from Section 3 of this official publication on the NS Sec is very important
“.1 Traditionally, the unit of analysis or class composition has been the family/household rather than the individual. The nuclear family is seen as the basic structural element because of the inter-dependence and shared conditions of family members. A family member’s own position may have less relevance to their life chances than those of another family member. A practical solution to this problem has been to select one family or household member as a reference person and take that person’s position to stand for the whole household.
3.2 Essentially, assigning an NS-SEC category to a household involves deciding which household member best defines that household’s position. This person is called the household reference person (HRP).
3.3 From 2001, the HRP has been defined as the person responsible for owning or renting or who is otherwise responsible for the accommodation. In the case of joint householders, the person with the highest income takes precedence and becomes the HRP. Where incomes are equal, the oldest person is taken as the HRP. This procedure increases the likelihood both that a woman will be the HRP and that the HRP better characterises the household’s social position.” I shall return to this issue after providing some information on the Approximated Social Grade as an approach to the definition and analysis of Social Class.
The Approximated Social Grade and Social Class.
The Approximated Social Grade System is used to classify households by the approximated Social Grade of each household’s household reference Person. Click here for an ONS document which provides detailed information on Approximated Social Grade System. The following extract from the ONS document lists the factors which are used to determine the Approximated Social Grade of Household References Persons.
“Social Grade is a socio-economic classification. This is a way of grouping people by type, which is mainly based on their social and financial situation. ASG is a model created by the Market Research Society for census data to estimate Social Grade. The ASG model for Census 2021 is based on characteristics of the Household Reference Person (HRP), including:
- current or most recent occupation using the Standard Occupational 2020 Code (SOC2020)
- sex
- economic activity status
- employment status and if they supervise or employ others
- highest level of qualification
- household tenure
- number of people and number of people aged 16 years and over in their household
- number of cars or vans in their household.”
The NS SEC Classification and the Approximated Social Grade Classification: Some Comparisons
Sizes of Social Classes [ Percentages] 2021 in the NS SEC and ASG Classifications
| NS SEC [Individuals] | NS SEC [Household reference person] | ASG Individual Household residents | ASG [Household reference person ] |
| NS SEC1 13.1 | NS SEC1 16.1 | AB 23.3 | AB 22.7 |
| NS Sec2 19.9 | NSSEc2 21.4 | ||
| NS SEC3 11.4 | NS SEC3 10.4 |
C1 32.8 |
C1 33.2 |
| NS Sec4 10.6 | NS SEC4 12.5 | ||
| NS SEC5 5.4 | NS SEC 5 6.5 | C2 21.3 | C2 20.1 |
| NSSEC6 11.4 | NS SEC 6 11.1 | ||
| NS SEC7 12.1 | NS Sec 7 13.0 |
DE22.6 |
DE 24.0 |
| NW and LTU* 8.5 | NW and LTU* 7.5 | ||
| Students 7.7 | Students 1.4 |
NW and LTU refers to Never worked and long term unemployed.
It is important to note that columns 1 and 3 measure different things Column I refers to the percentages of individuals in the various NS SEC classes whereas Column 3 refers to the percentages of household residents who live in households headed by Household reference persons in Classes AB, C1, C2 and DE respectively. In any case, our main concern is with Columns 2 and 4.
For the e key conclusion of the statistics Click here for further detailed information on the Approximated Social Grade System and scroll down to Section Three from which I have taken the following Extract
“Comparing Approximated Social Grade (ASG) with National Statistics Socio-economic Classification (NS-SEC)
Social Grade and NS-SEC are both used to classify the social and financial situations of households based on the characteristics of the Household Reference Person (HRP). However, as they have different purposes, different methods of classification are needed. For Census 2021 data, ASG classes usual residents in households where the HRP is aged 16 to 64 years (71.1% of all HRPs), whereas NS-SEC is used for usual residents in households where the HRP is aged 16 years and over (99.9% of all HRPs). Additionally, NS-SEC is solely based on the HRP's occupation, whereas ASG uses additional indicators of affluence such as the HRP's highest level of qualification, car ownership and tenure. As such, differences between the two variables may be because of the differences in the population or difference in the exact methodology. For more information about the differences between ASG and NS-SEC, see Section 6: Measuring the data.
Nonetheless, it is useful to broadly compare ASG and NS-SEC because they both group HRPs on their occupation and should classify HRPs of "working class" and "middle class and above" grades at similar proportions. In this instance, "working class" relates to routine and manual occupations and people in long-term unemployment. For ASG, 44.1% of HRPs could be considered "working class" belonging to the C2 or DE categories. For NS-SEC, this was lower, as 38.0% of HRPs could be considered as "working class" by combining all categories from "L10: Lower supervisory occupations to "L14: Never worked and long-term unemployed".
The "middle class and above" social group includes administrative, managerial and professional occupations and full-time students. By combining the AB and C1 categories, 55.9% of HRPs could be considered "middle class and above" using ASG. Whereas, using NS-SEC, 62.0% of HRPs could be considered "middle class or above" when categories from "L1: Higher managerial, administrative and professional occupations" to "L9: Own account workers" and "L15: Full-time students" are combined.
|
Appendix: Finding the data. Students may certainly disregard this Appendix for examination purposes although it may be of interest if they are keen to search the sources of official data Sources of the above statistics Column 1 Click here for NS -SEC data from the 2021 Census - Scroll to Section 4 Column 2 Click here for the link to the relevant NOMIS webpage. You then have to Click on Query data and follow the instructions and Click here for a worked example showing the distribution of Household Reference Persons among the NS SEC Classes. These data are then converted to Percentages For Columns 3 and 4 Click here for the basic explanatory page. For Column 3, Click here for a link to the relevant Nomis webpage. You then have to Click on Query data and follow the instructions. Click here for a worked example showing the distribution of Households among the Approximated Social Grades. These data are then converted to percentages For Column 4 Click here for the basic explanatory page and click here for the relevant nomis page. You then have to Click on Query data and follow the instructions. Click here for a worked example showing the distribution of usual residents of households classified by the approximated social grade of their Household Reference Persons aged 16-64. These data are then converted to percentages
|
- The NS SEC and Long-term Changes in the UK Class Structure
- In the following diagrams the original NS SEC categories have been collapsed into 5 categories and estimates have been made for the distributions of individuals among these 5 categories prior to 2001, which is when the NS SEC Classification was first introduced. It is clear that since 1951 the proportions of male and female workers in the Managerial and Professional category have increased, and the proportions of male and female workers in the routine and semi-routine occupations have declined. The proportion of female workers in the intermediate occupations has declined, but it remains higher than the proportion of males in these occupations and the proportions of both males and females in working class occupations have declined.digrams need to be properly copied in.
| Male labour force by occupational class 1951-2016
Census and 2016 Annual Population Survey |
Female labour force by occupational class 1951-2016
Census and 2016 Annual Population Survey |
 |
 |
Great British Class Survey Click here or further information on The Great British Class Survey] which, for example explains the differences in the percentages between Column 2 and Column 3 in the following table.
The New Working Class: Claire Ainsley 2018
Click here for a review of The New Working Class
Click here for a presentation by Claire Ainsley on the 2019 General Election
Claire Ainsley is a former Executive Director of the Joseph Rowntree Foundation who is now Head of Policy for the leader of the Labour Party Keir Starmer. In this study she has used the findings of the Great British Class Survey to argue for the existence of a “New Working Class” which contains the final three categories in the GBCS Schema and thus accounts for 48% of the population. She also believes that some members of the technical middle class [6%] and new affluent workers [15%] might identify with the new working class but “they are not core to the definition of the new working class.”
The British Social Attitudes Survey 2016: Subjective Assessments of Social Class Membership
Click here for the “Headline Page” on the Social Class chapter from the British Social Attitudes Survey 40 [2023] from The National Centre for Social Research and follow the link to download the PDF of the full chapter r on Social Class .t
In their article for the 2023 British Social Attitudes Survey Oliver Heath and Monica Bennett have provided information on contemporary perceptions of the nature of the UK class structure. Among the key points which they make are the following:
To investigate class identity 2 questions are asked in the British Social Attitudes Survey.
Do you ever think of yourself as belonging to any particular social class?
Yes, middle class
Yes, working class
Yes, other (please write in)
NO
The Headline Page illustrates the trends in the answers to this question from 1987 to 2022.
The proportion of respondents answering No has often exceeded 50% between 1987 and 2022 but has declined very significantly from 55% in 2015 to 22% in 2022. Correspondingly the percentages of respondents identifying as middle class increased from 20% to 29 % and identifying as working class from 23% to 46%
If respondents did not spontaneously put themselves as either “middle” or “working class”, they were prompted to do so with this follow-up question
Most people say they belong either to the middle class or the working class. If you had to make a choice, would you call yourself middle class or working class.
Between 33% and 38% of respondents identified as middle class in the prompted question between 1987 and 2019 but this rose to 43% in 2021.Around 57%- 61% of respondents identified as working class in the prompted question but this fell significantly to 52% in 2021.
See Page 11 of the PDF for detailed statistical trends
With regard to the possibility that Britain is becoming a classless society, the Headline Page disputes this conclusion
Some information from the BSA Survey of 2016
Click here for an LSE item on the British Social Attitudes Survey
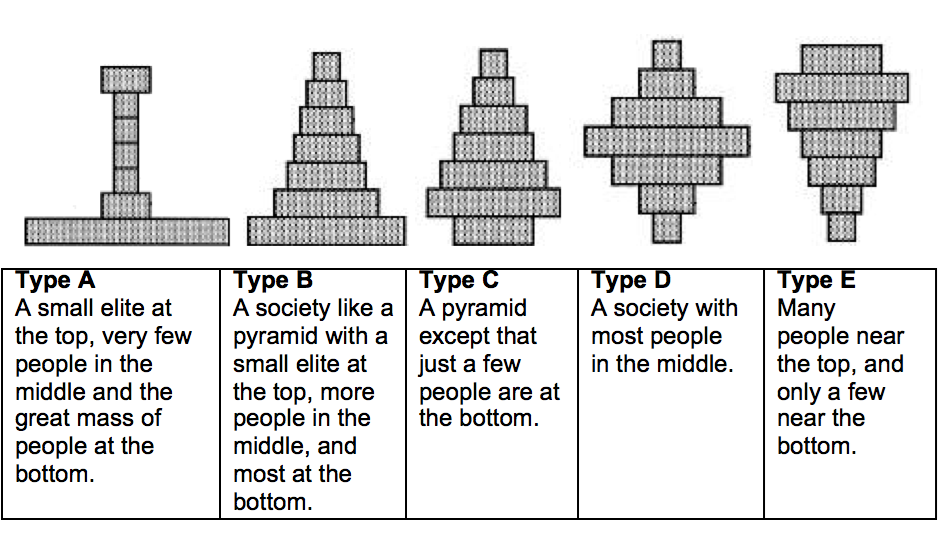
In this article the author reproduces the following diagram from the original survey [Page 16] which describes different perceptions of the overall British class structure. You might like to discuss this diagram with your teachers.
Conclusions:
The Conclusions were stated in my Summary Introduction which I repeat here.
Recent Statistics on the Measurement of Social Class
Various statistical schemes have been used to delineate the overall shape of the “UK” class structure and the size of the working class within that structure although some of the statistics refer to the England and Wales only rather than the UK.
The Registrar General’s Classification: [45% of employees were working class in 1991].
THE NS SEC System :38.1% of Households based on Household Reference Person] were working class in 2021.
The Approximated Social Grade System: 44.1% of Households based on Household Reference person] were working class in 2021
The Great British Class Survey: ]48% of survey respondents were in the final three class categories of the GBCS which might be seen as comprising the working class although it could be argued that some new affluent workers are also part of the working class.
Claire Ainsley and the New Working Class: Claire Ainsley includes the final three categories of the GBCS in her definition of the New Working Class but also states that . “It is possible that some members of the technical middle class [6%] and new affluent workers [15%] might identify as working class depending on their class background and societal associations but they are not core to the definition of the New Working Class”
The National Centre for Social Research: British Social Attitudes 40: Social Class. Answering the unprompted question in 2022, 46% of respondents identified as working class and 29% identified as middle class. 22% identified with no social class Answering the prompted question in 2021, of respondents who did not initially identify with any social class 52% now identified as working class and 43% now identified as middle class. It is important to note that many respondents who were objectively middle class in terms of occupation nevertheless identified as working class.
Another important conclusion of the Survey is that “There is no consistent evidence that people have become less likely to identify as middle or working class, while, despite the growth in white-collar jobs, more people identify as working than middle class. At the same time people are more aware of class inequalities in Britain.”
In any case, as is indicated elsewhere on this site , detailed analysis of the proletarianisation theory and the embourgeoisement theory indicate that the boundary between the middle class and the working class is uncertain
Part Three: The Working Class, Living Standards and Life Chances
We cannot, therefore, be certain as to the size of the UK working class but whatever its size it can be agreed that members of the working class have been and continue to be disadvantaged in various ways relative to members of the middle and upper classes and that these disadvantages are especially clear as between the semi- and unskilled members of the working class and the professional and managerial sections of the non-manual middle class.
Some more affluent members of the working class are living fairly well but on average, members of the working class are likely to be disadvantaged relative to members of middle and upper classes in terms of the following criteria.
Wealth ownership, including financial wealth, home ownership and ownership of consumer durables
Current incomes and hence living standards
Job security and likelihood of unemployment
Working conditions and degree of autonomy at work
Fringe benefits
Promotion prospects
Pension rights
Risk of poverty Click here for documentary: Poor Kids and click here for The heat or eat diaries.
Educational qualifications and prospects for upward social mobility
Housing quality
Risk of exposure to pollution dangers
Levels of health and life expectancy
Limited political influence
These factors indicate that essentially the working class is disadvantaged because of its subservient economic position within the capitalist system but it is argued, most notably by Marxists, that the economic subservience of the working class is reinforced by its limited influence over the institutions of the state. However, in democratic pluralist theories of the state it is argued that the working class can exercise more political power via social democratic parties [such as the Labour Party in the UK] and via other sympathetic pressure groups such as, especially, the trade unions and via welfare oriented groups such as the Child Poverty Action Group and Shelter. Alternative theories of political power and the state are outlined here.
It has often been claimed that the UK is gradually becoming a classless society but data on the above variables do suggest that the patterns of inequality which currently exist in the UK impact very adversely on the living standards and life chances of members of the working class. Even in the2020s many sociologists would agree that the UK remains very much a class -divided society. However, as we shall see later, the theory of the classless society has resurfaced recently in the work of Beck and of Pakulski and Waters
Some Recent Sources
Click here for Real wages effectively flat-lined in the lost decade of growth
Click here for BBC data on economic growth and real wages trends
Click here for self-employment
Click here and here for Trade union membership
Click here for zero hours contracts
Click here for the National Minimum Wage
Click here and scroll down for In Work Poverty
Click here for welfare state/inequalities attitudes