Section 3[c]
Vocational and Higher Education
Gender Differences in Subject Choice: Vocational Education
Gender, Subject Choice and Higher Education
Section 4 :
An introductory essay on Gender and Subject Choice which relies on data from Sections One and Two
Gender Differences in Subject Choice: Vocational Qualifications
You may click here for some information on gender differences in patterns of employment
Many 16 year olds do not enrol on GCE Advanced Level courses and may take BTEC courses [or most, recently T Level courses] or they may progress directly to employment which may well involve taking up an apprenticeship or enrolling on a wide range of vocational courses. The relative quantitative importance of these alternatives is illustrated in this article from the BBC [August 2020].
This article indicates that apprenticeships and vocational qualifications are increasing in importance [Chart 4]; and that increasing numbers of students have taken BTEC National courses either as alternatives to GCE Advanced Levels or in combination with them and gained access to Higher Education based on their BTec qualifications. Also research by the Social Market Foundation has shown that it is white working class students and some ethnic minority students who are especially likely to take this route to Higher Education .
It is well known that working class male and female students are more likely to be unsuccessful at GCSE level. These students are perhaps also more likely to have been socialised into traditional gender roles and to believe [correctly] that their employment prospects, although limited, are best in traditional male and female occupations. Many relatively unsuccessful female students may therefore opt for subjects such as Domestic Science or Health Care partly because they do not infringe traditional views of femininity, partly because of better employment prospects in these areas and partly because the skills gained are seen as being useful for their future roles as housewives/mothers. Relatively unsuccessful boys are likely to opt for Construction and Building, Engineering or Computing and Technology options for much the same reasons.
Gender differences in choice of Apprenticeship schemes are very marked and can surely be explained in terms of the ongoing strength of traditional socialisation processes and continuing gender differences in employment opportunities. It could indeed be argued that choices of such schemes have much more power than do A level and Degree level subject choices to confirm or undermine traditional perceptions of femininity and masculinity.
You may click here and scroll down to pages 16-17 for data indicating that in recent years females have been more likely to take up apprenticeships than males. This trend is clearly related to the relative decline of manufacturing employment in the UK economy. However Click here for a recent item from FE News which provides the following information on sectoral differences in the gender take up of apprenticeships
“Sector representation: Female apprentices work in fewer sectors than their male counterparts. Research by the Young Women’s’ Trust (YWT) “Making Apprenticeships Work for Young Women” in 2016 found that 25% of all female apprentices work in Health and Social Care and 14% in Business Administration. Only 6% of male apprentices work in Health and Social Care and 6% in Business Administration. Females mainly work across only five sectors whilst male apprentices mainly work across 11 sectors. Later research produced in 2018 by YWT reported that for every one female apprentice in construction there were 50 males, and in engineering one female for every 25 male apprentices.”
There are also significant gender differences in Choices of BTEC options as is indicated in this article from ffteducationdatalab. Males are far more likely than females to opt for Engineering Studies, Computing and Construction and Females are far more likely than males to opt for Health Studies, Animal Management and Speech and Drama.
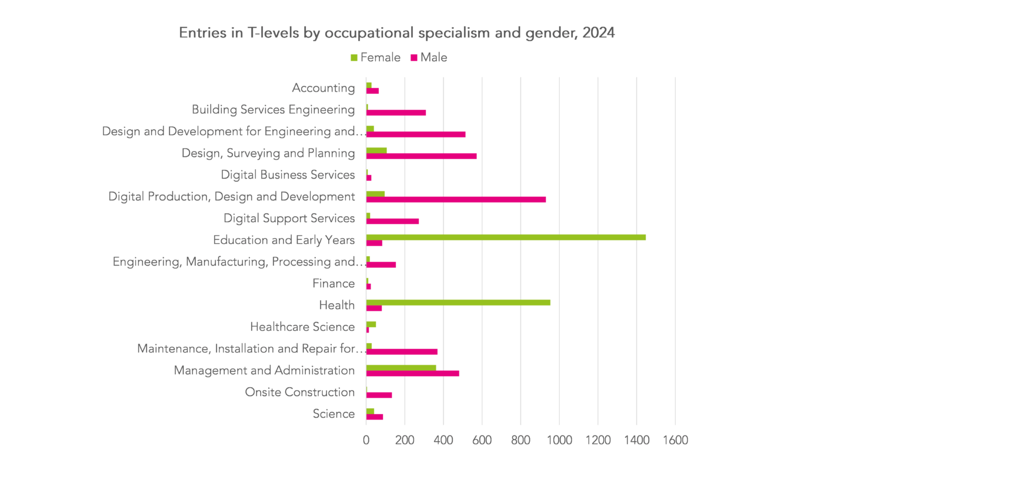
Gender, Subject Choice and T Levels
Following the introduction of T Levels, the Conservative Government announced that funding was to be withdrawn from a wide range of other vocational courses including some Advanced General Qualifications such as BTEC and OCR National courses. This decision provoked widespread criticism yet as of 2024 it it was clear that the Conservative Government intended to go ahead with the defunding of these courses while uncertainty around the long-term future of T levels increased as a result of another Government proposal that both GCE Advanced Level courses and T Levels would eventually be replaced by a new Advanced British Standard Qualification. In the event, Labour won the General Election of 2024 and announced that T levels would be retained but reformed and also that 157 of the vocational qualifications which the Conservatives had intended to defund would be retained although more than 200 such courses would have their funding withdrawn from August 2025. Further details on T Level courses may be found in Part 5 of this document here. Very useful information on Gender Differences in take up of T Level Courses my be found in this ffteducationdatalab article from which I have extracted the following diagram.
Gender, Subject Choice, and Higher Education
Click here For HE Student Enrolments and Personal Characteristics 2018/19-2022/23 . Females continue to be more likely than males to enrol for Higher Education Courses. The sex of some students is unknown
Females are more likely than males to enrol in Higher Education but there are significant variations as between females eligible and ineligible for free school meals. Click here for DFE publication October 24 Widening Participation in Higher Education, Females are also nowadays more likely than males to gain First Class and Upper Second Class degrees as indicated in the following table. Click here for HESA Data and scroll down to Table Percentage of first degree qualifiers obtaining each qualification Academic Years 2018/19 to 2022/23
Females predominate in subjects allied to Medicine, Psychology, Social Sciences Languages and in Design and creative and performing arts. Males predominate especially in Engineering and Technology and Computing. Business and Management courses are very popular with both males and females.
| 1st Class % | 2:1% | 2.2% | 3rd/Pass % | |
| Males 2017/18 | 27 | 46 | 21 | 5 |
| Females 2017/18 | 28 | 50 | 18 | 4 |
| Other 2017/18 | 33 | 48 | 15 | 4 |
| Males 2018/19 | 27 | 46 | 21 | 5 |
| Females 2018/19 | 29 | 50 | 18 | 4 |
| Other 2018/19 | 33 | 45 | 19 | 3 |
| Males 2019/20 | 34 | 46 | 21 | 5 |
| Females 2019/20 | 36 | 48 | 14 | 3 |
| Other 2019/20 | 41 | 40 | 17 | 3 |
| Males 2020/21 | 35 | 46 | 16 | 3 |
| Females 2020/21 | 37 | 46 | 13 | 3 |
| Other 2020/21 | 45 | 43 | 9 | 3 |
| Males 2021/22 | 31 | 46 | 19 | 5 |
| Females 2021/22 | 33 | 47 | 16 | 5 |
| Other 2021/22 | 38 | 44 | 15 | 3 |
However, the gender differences in subject choice which occur at Advanced Level continue in Higher Education and there are significant gender differences in subject choice at first degree level which rare replicated also at post graduate level. Click here Females predominate in subjects allied to Medicine, Psychology, Social Sciences Languages and in Design and creative and performing arts. Males predominate especially in Engineering and Technology and Computing. Business and Management courses are very popular with both males and females,
I have downloaded the 2020/21 chart data below. As an exercise you might like to highlight in different colours the subjects which are most likely the subjects which are most likely to be chosen by Female, Male and Other students.
| Subject | Female | Male | Other | Not known | Total |
| 01 Medicine and dentistry | 47,435 | 29,445 | 155 | 0 | 77,035 |
| 02 Subjects allied to medicine | 269,305 | 69,445 | 395 | 0 | 339,150 |
| 03 Biological and sport sciences | 58,050 | 59,050 | 220 | 0 | 117,320 |
| 04 Psychology | 109,505 | 25,265 | 315 | 0 | 135,080 |
| 05 Veterinary sciences | 9,430 | 2,100 | 45 | 0 | 11,575 |
| 06 Agriculture, food and related studies | 12,070 | 6,325 | 30 | 0 | 18,425 |
| 07 Physical sciences | 29,045 | 39,005 | 150 | 0 | 68,195 |
| 09 Mathematical sciences | 18,010 | 30,405 | 110 | 0 | 48,530 |
| 10 Engineering and technology | 36,875 | 146,060 | 225 | 0 | 183,160 |
| 11 Computing | 32,480 | 120,975 | 370 | 0 | 153,825 |
| 13 Architecture, building and planning | 23,970 | 38,195 | 70 | 0 | 62,235 |
| 26 Geography, earth and environmental studies (natural sciences) | 17,005 | 15,335 | 55 | 0 | 32,400 |
| Total science CAH level 1 | 663,180 | 581,610 | 2,135 | 0 | 1,246,920 |
| 15 Social sciences | 188,365 | 93,725 | 525 | 0 | 282,615 |
| 16 Law | 87,805 | 50,170 | 105 | 0 | 138,080 |
| 17 Business and management | 225,915 | 248,675 | 380 | 0 | 474,970 |
| 24 Media, journalism and communications | 28,895 | 18,585 | 145 | 0 | 47,625 |
| 19 Language and area studies | 66,895 | 25,250 | 495 | 0 | 92,635 |
| 20 Historical, philosophical and religious studies | 46,890 | 38,750 | 300 | 0 | 85,940 |
| 25 Design, and creative and performing arts | 120,355 | 68,710 | 1,080 | 35 | 190,180 |
| 22 Education and teaching | 104,995 | 30,795 | 250 | 0 | 136,045 |
| 23 Combined and general studies | 28,265 | 16,190 | 70 | 0 | 44,525 |
| 26 Geography, earth and environmental studies (social sciences) | 7,235 | 5,070 | 20 | 0 | 12,330 |
| Total non-science CAH level 1 | 905,620 | 595,920 | 3,370 | 35 | 1,504,945 |
| Total | 1,568,795 | 1,177,525 | 5,505 | 35 | 2,751,865 |
Click here for data on Gender and degree subject 2022/23. There has been little change since 2021/22.
Useful Links
Click here for a report from HEP1 on the underachievement of young men in higher education and here for Guardian coverage of this report May 2016
Click here for Mind The Gap: Gender Differences in Higher Education [Rachel Hewitt; 2020]
Click here for Women and STEM
Click here for recent information on Women in STEM Statistics
Click here For Section 4